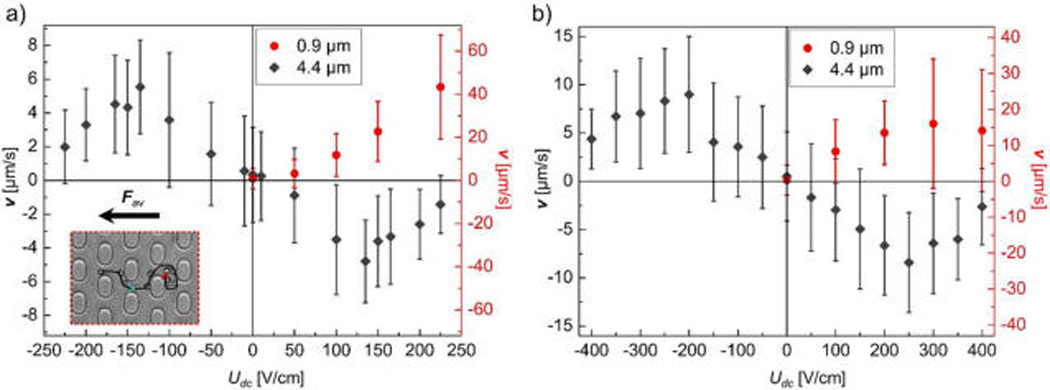
Figure 3.

Experimental results of migration velocity vs DC offset. Diameters of 0.9 and 4.4 µm are represented by solid circle and solid diamond, respectively. The error bars represent the standard deviations of the velocities as obtained at each applied potential from tracking over 230 particle trajectories for 4.4 µm beads and 40 trajectories for 0.9 µm beads. (a) Uac = 275 V/cm and |Udc| < Uac. (b) Uac = 450 V/cm and |Udc| < Uac. The 4.4 µm beads had dANM behavior in both (a) and (b), while 0.9 µm beads migrated “normally” following Fav. The inserted stroboscopic image in (a) shows the trajectory of a 4.4 µm bead in a complete driving period at Udc = −135 V/cm (see Video S-3). At −Udc + Uac, the bead moved along the depicted trajectory following the turquoise arrowhead. At −Udc − Uac, it was trapped at the position marked by the red arrowhead. This resulted in the dANM migration of the bead since its net migration was to the right while Fav pointed to the left.
