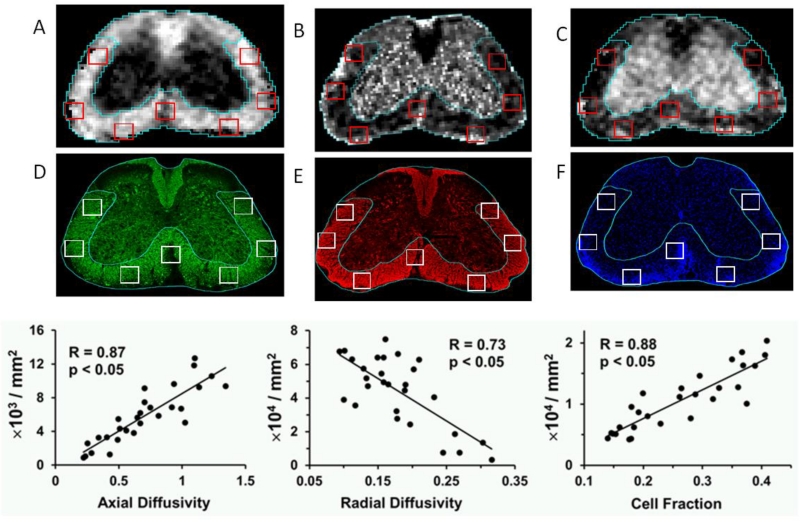
Figure 4. DBSI performed on living EAE-affected mice correlates with axon content, myelination and cell count within mouse spinal cords.
Representative in vivo DBSI derived (A) axial and (B) radial diffusivity, and (C) cell fraction maps co-registered with immunohistochemical staining for (D) phosphorylated axons using SMI-31, (E) myelin using anti-myelin basic protein antibody, and (F) cell content using DAPI stain with identical ROI co-localized. Modeling of DBSI used in these studies was for white matter, and thus seven regions of interest within white matter were analyzed at four different time points during the course of EAE. The correlation between (G) axial diffusivity and SMI-31 positive axon counts (R=0.87, p<.05), (H) radial diffusivity and MBP positive axon counts (R=.73, p<.05), and (I) cell fraction and DAPI counts (R=0.88, p<.05) of spinal cord (at L2 level) from EAE-affected C57BL/6 mice at baseline, onset, peak, and chronic states were determined. Scale bar = 300 μm. Diffusivity = μm2/ms.

