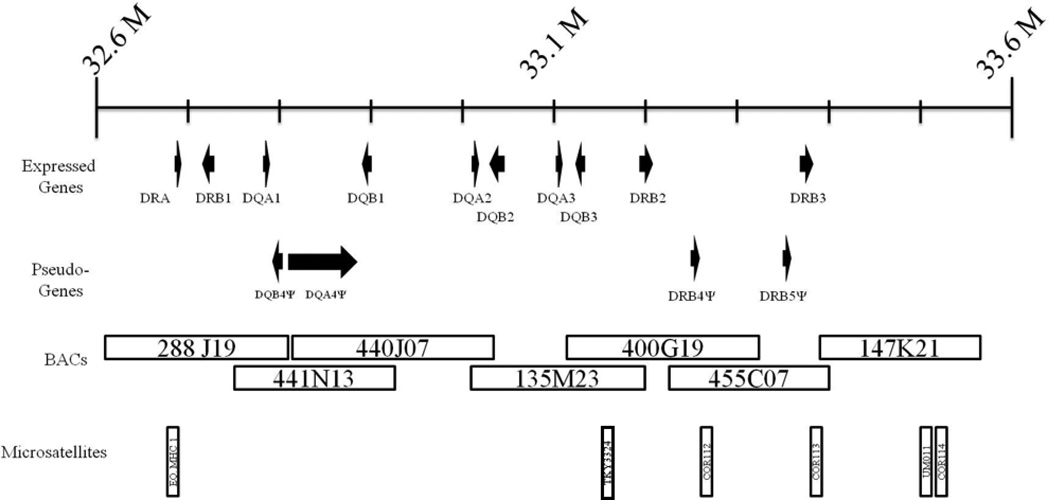
Figure 1. Map of Equine MHC Class II region on ECA 20.
Upper line demarcates the Class II region from 32.6M to 33.6M based on the Broad Assembly v2. Expressed genes are shown directly beneath the ECA 20 ruler. Length of genes is proportional to width of arrows; direction of gene transcription follows direction of arrows. Pseudogenes are noted below expressed genes. Overlapping Bacterial Artificial Chromosome clones (BACs) from the minimal tiling path are labeled in horizontal boxes. Microsatellite loci are shown in vertical boxes: EqMHC1, M. Binns personal communication. COR112, COR113, COR114 - Tseng et al. 2010. UM011 – GenBank Acc. # AF195130. See Table S1 for details of microsatellites.

