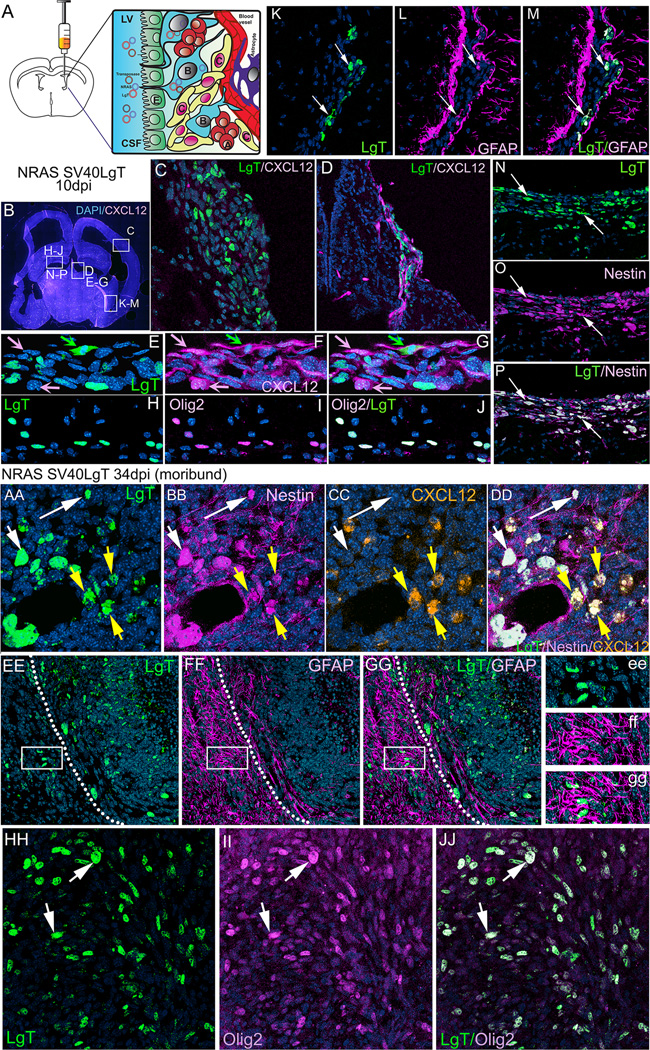
Figure 1. Gliomas induced by transforming NPCs in neonatal mice with oncogenic DNA express markers characteristic of neural stem cells and glioma stem-like cells: Nestin, GFAP and Olig2.
A. Schematic representation of the method used to induce NSC derived GBM. Plasmids encoding the Sleeping Beauty transposase and oncogenic DNA, flanked by transposable elements, are injected into the lateral ventricle of postnatal day one mice. The DNA is taken up by neural stem cells (B cells), in direct contact with the lateral ventricle through their cilium, which protrudes in between the ependymal cells (E) lining the ventricle. Normally, B cells will give rise to transient amplifying cells (C cells) which then differentiate into migrating neuroblasts (A cells). Uptake and transposon mediated genomic integration of oncogenic DNA into NSC cells gives rise to transformation of proliferating C cells into tumor cells and their guided division and migration alongside blood vessels (D) or diffusely through the forebrain parenchyma (C) to generate tumors with GBM characteristics. B.10 days post injection (dpi) a coronal section through the brain of an 11 day old mouse (CXCL12dsRed) injected at P1 with NRAS and SV-40 LgT. White rectangles represent areas depicted in panels C, D, E–G, H–J, K–M and N–P. C. Region of diffuse tumor cell proliferation ventral to the cortex and bordering the enlarged ventricle shows expression of LgT in transformed cells invading into the brain parenchyma. D. Region of tumor cell migration (green, LgT positive) alongside CXCL12 positive endothelial cells (magenta), close to the midline choroidal plexus in the lateral ventricle. Some cells are double positive for CXCL12 and LgT. E–G. Enlarged area from panel D illustrating co-localization of LgT (green) and CXCL12 (magenta) in some cells (green arrow), whereas most CXCL12 positive cells (vascular endothelial cells) do not express LgT (pink arrows). H–J Region bordering the lateral ventricle where LgT positive cells (green) are shown to express the glioma stem cell marker Olig2 (magenta). K–M Region of the lateral ventricle at the ventral interface between the hippocampus and cortex where LgT expressing tumor cells (green) are shown to co-express GFAP (white arrows). Visible to the left and right of the transformed cells are the rows of GFAP+ neural stem cells of the SVZ. N–P. Region of tumor cell proliferation ventral to the hippocampus illustrating co-localization of all LgT positive cells (green) with the NSC marker nestin (magenta) (white arrows). Note the stream of tumor cells invading away from the ventricle into the brain parenchyma. The nuclear stain DAPI (blue) was used in all panels.
AA–NN. After 19 days NRAS and SV40-LgT transformed cells proliferated to form several incipient tumors aggregated alongside ventricles (BB–EE, II–KK) or within the septal region (FF–HH) and continue to express Nestin, GFAP and Olig2. AA–JJ Tumor cells induced with NRAS and SV40-LgT from moribund animal (34dpi) continue to express the neural stem cell marker Nestin and the glioma stem cell marker Olig2 but lose expression of GFAP. AA–DD. Magnified view of a region within the core of the tumor showing LgT positive cells (green) expressing Nestin (magenta) and some cells also express CXCL12 (orange). White arrows in AA–DD point to cells co-expressing LgT and Nestin, whereas yellow arrows point to cells expressing all three markers: LgT, Nestin and CXCL2. Panels EE–GG illustrate a region at the margin of the tumor (dotted white line) showing extensive staining with GFAP outside the tumor border (magenta), indicative of a massive reactive gliosis. LgT positive cells (green) do not express GFAP, not even the invasive cells migrating outwards from the tumor (white rectangle in E–G and ee–gg). HH–JJ. Tumor cells from moribund animals (LgT+ green) continue to express the glioma stem cell marker Olig2 (magenta). All LgT+ cells are Olig 2 positive.

