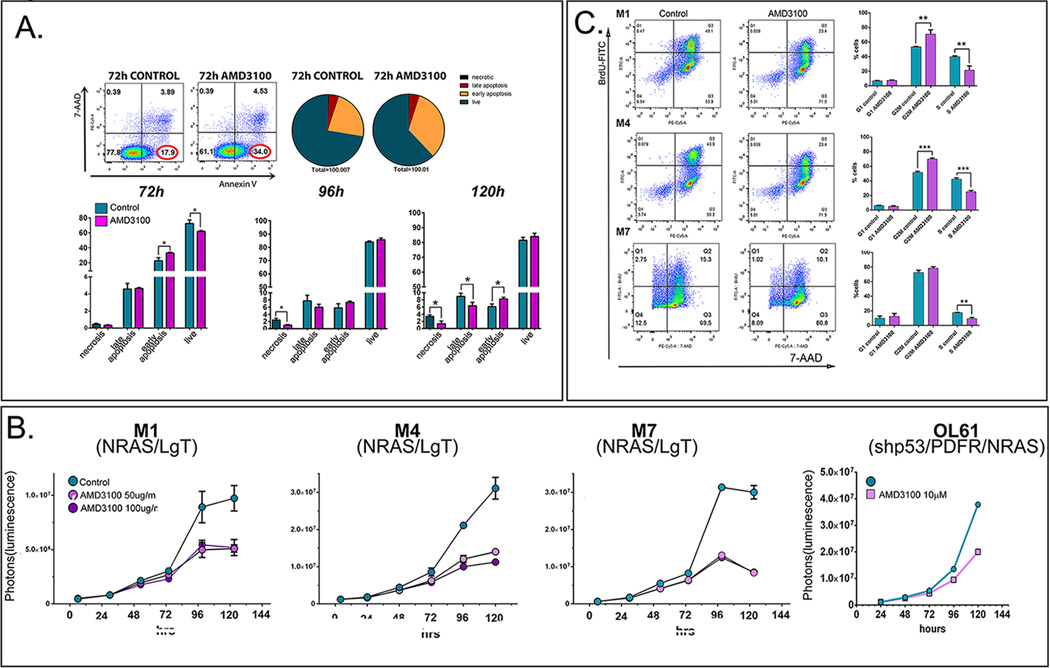
Figure 3. Treatment of NPC derived GSCs with AMD3100 (Plerixafor) induces apoptosis, decrease in cell proliferation and arrests cells in the G2M phase of the cell cycle.
A. Representative dot-plots of M7 (NRAS/LgT) cells treated or not with AMD3100 for 72h and stained with Annexin V- FITC (horizontal axis) and the fluorescent DNA dye 7-amino-actinomycin D (7-AAD, vertical axis). Pie-charts represent the quantitative distribution of cells within each treatment group: live cells (Annexin V negative and 7AAD negative, hunter-green), early apoptotic cells (Annexin V positive, 7-AAD negative, orange), late apoptosis (Annexin V positive, 7-AAD positive, red), necrotic (Annexin V negative, 7-AAD positive, black). Lower panels represent quantitative analysis of the distribution of live, necrotic and apoptotic cells during the 5 day treatment with AMD3100. B. Proliferation analysis of four different GBM cell lines induced with NRAS and LgT (M1, M4, M7) or shp53/PDGF/NRAS (OL61) during a time-course of 120 hours treated or not with AMD3100. C. Cell cycle analysis of M1, M4 and M7 after 96h of treatment with AMD3100 and a one-hour pulse of BrdU. Cells were stained for BrdU-FITC and 7-AAD and analyzed by flow-cytometry. Representative dot plots are presented to the left and quantitative analysis of cell cycle phase distribution is presented to the right ( G1: BrdU negative, 7-AAD low, G2/M: BrdU negative, 7-AAD high, and S phase: BrdU positive) (unpaired, two-tailed t-test * p<0.05, ** p<0.01, *** p<0.001).

