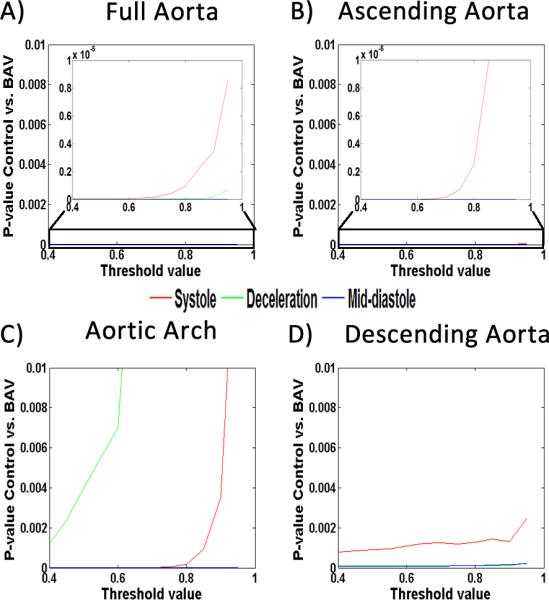
FIGURE 3. Absolute local normalized helicity sensitivity analysis.

Absolute local normalized helicity sensitivity analysis. The analysis was perform in the full aorta (A), the ascending aorta (B), the aortic arch (C), and the descending aorta (D). Sub-plot in panel A and B corresponds to the zoomed area within the black rectangle. P-values <0.01 were obtained using a threshold of 0.6.
