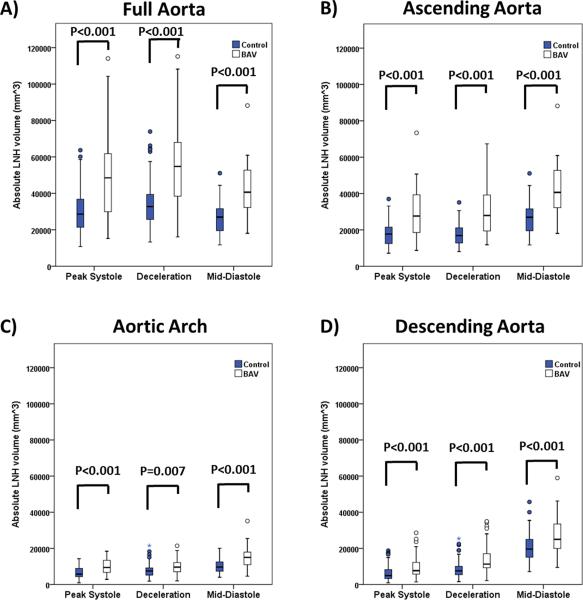
FIGURE 4. Absolute local normalized helicity comparison between healthy controls and patients for all segments.
Absolute local normalized helicity comparison between healthy controls and patients for all segments. Volume corresponded to absolute local normalized helicity (LNH) >0.6. Analysis segments corresponded to the full aorta (A) which was further sub-divided on ascending aorta (B), aortic arch (C), and descending aorta (D). Comparison between healthy controls vs. BAV groups was given by a t-test. Outliers, circles, were defined by 1.5 × interquartile range. Extreme values, stars, were defined by 3 × interquartile range.

