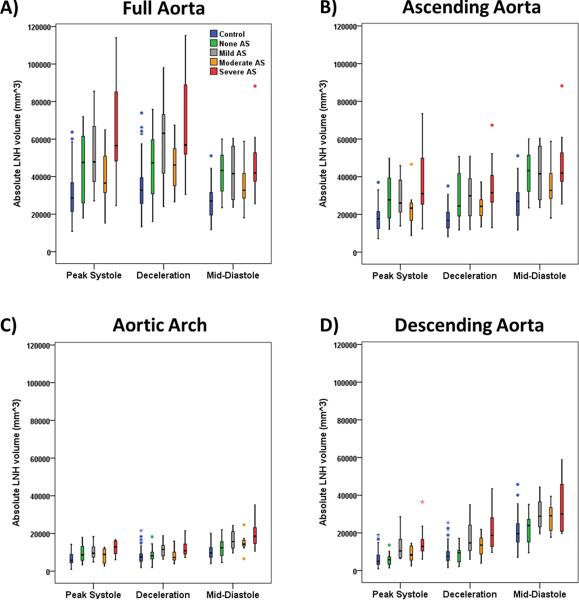
FIGURE 6. Comparison of absolute local normalized helicity between aortic stenosis severity groups and controls.
Comparison of absolute local normalized helicity between aortic stenosis severity groups and controls. Volume corresponded to absolute local normalized helicity (LNH) >0.6. Analysis segments corresponded to the full aorta (A) which was further sub-divided on ascending aorta (B), aortic arch (C), and descending aorta (D). Comparison between healthy controls and BAV stenosis severity groups are summarized in Table 4. Outliers, circles, were defined by 1.5 × interquartile range. Extreme values, stars, were defined by 3 × interquartile range.

