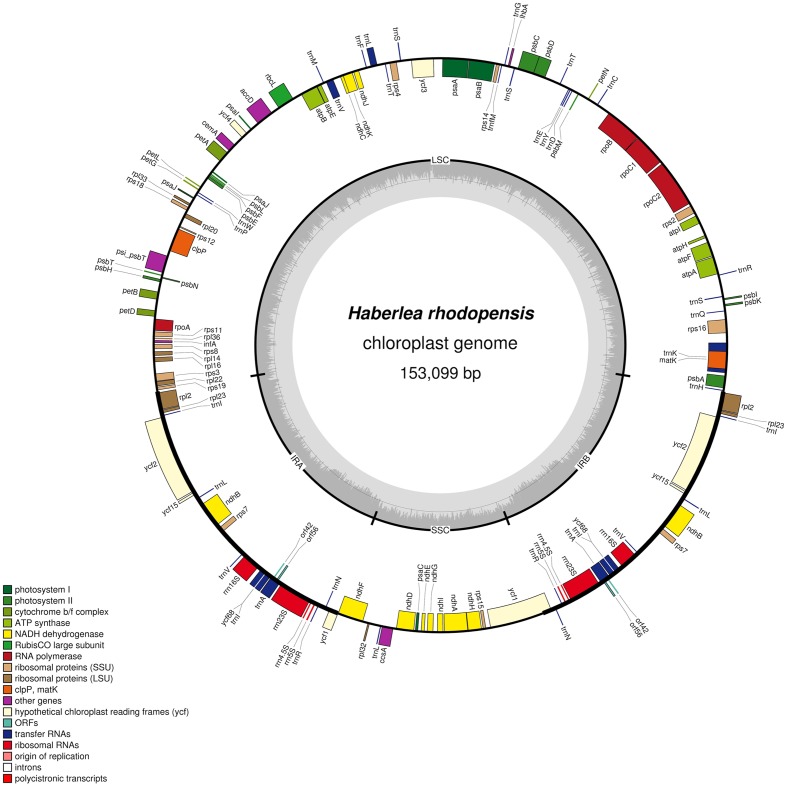
FIGURE 1.
Circular map of the chloroplast genome of H. rhodopensis: Genes drawn within the circle are transcribed clockwise, while genes drawn outside are transcribed counterclockwise. Genes belonging to different functional groups are color coded. Dark bold lines show Inverted repeats (IRa, IRb). The dashed area in the inner circle indicates CG content in the chloroplast genome. The map is drawn by OGDRAW.

