
FIGURE 5.
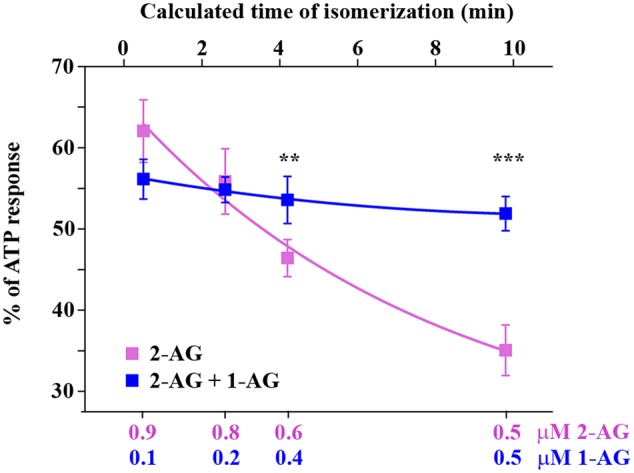
CB1 receptor mediated intracellular Ca2+ increase in response to application of 2-AG alone and in combination with 1-AG. Each data point represents an AUC value of Ca2+ transients expressed as percentage of response to 180 μM ATP. Decreasing concentrations of 2-AG induce diminished Ca2+ transients (magenta). This effect is compensated by increasing amounts of 1-AG, i.e., 1-AG at low concentration acts as competitive antagonist, but its effect turns to additive as its concentration increases (blue). The values on the top abscissa were calculated from the ratio of the artificial mixtures of the two isomers with the aid of Figure 1E. ∗∗p < 0.01; ∗∗∗p < 0.005.