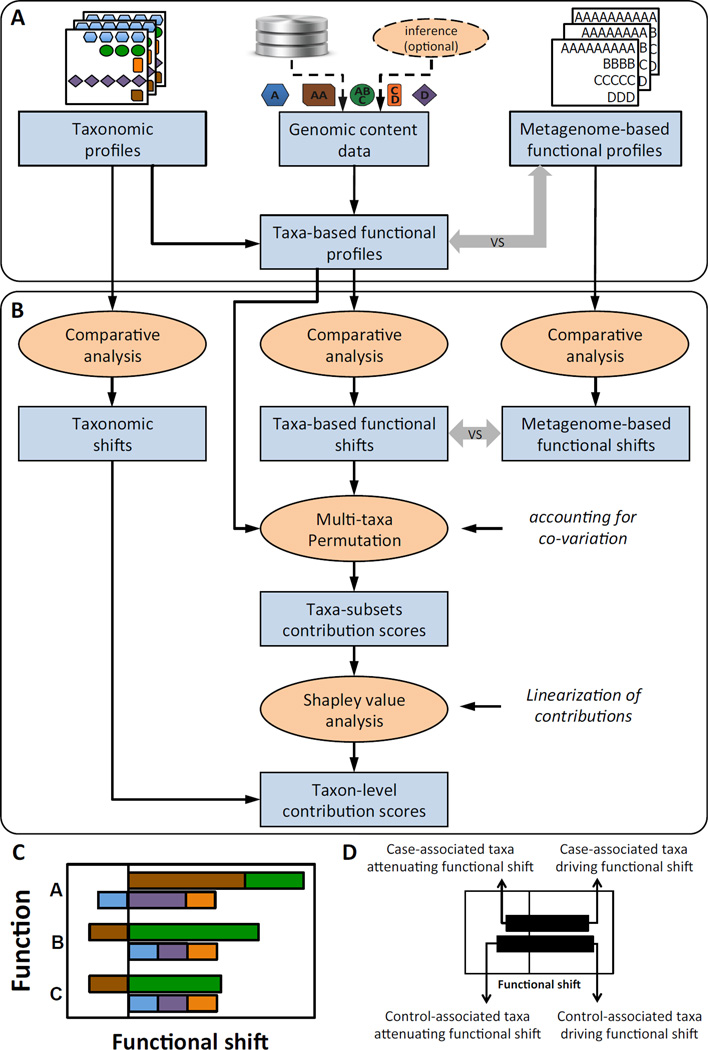
Figure 2. The FishTaco framework.
(A) FishTaco first processes the input data (including taxonomic profiles, metagenome-based functional profiles, and optionally the genomic content of each taxon) to generate taxa-based functional profiles. If genomic content is not provided, a previously introduced inference method can be used. Taxa-based and metagenome-based functional profiles are compared to assess how well they recapitulate the abundances of the various functions in the metagenome. (B) FishTaco then quantifies the contribution of each taxon to observed shifts in each function. Taxa-based functional shifts between cases and controls are compared to metagenome-based shifts to confirm that the taxa-based profiles exhibit similar shifts to those observed in the metagenome. A multi-taxa permutation analysis is then used (accounting for taxa co-variation) to assess the contribution of a large ensemble of taxa subsets to observed shifts, followed by a Shapley value analysis to obtain taxon-level linearized contribution scores (see Methods). (C–D) An illustration of a FishTaco-based taxon-level contribution profile, decomposing functional shifts into taxon-level contribution scores, and of the 4 different contribution modes identified by FishTaco.

