
FIGURE 1.
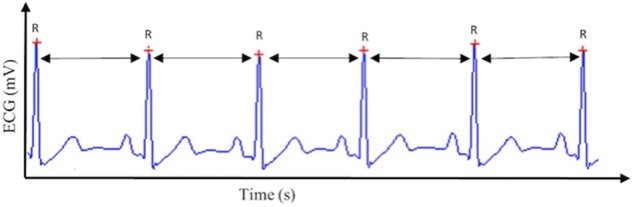
Heart rate variability (HRV). This figure displays the way HRV is calculated based on the R–R intervals of the QRS complex extracted from the electrocardiogram (ECG) signal.
Official websites use .gov
A
.gov website belongs to an official
government organization in the United States.
Secure .gov websites use HTTPS
A lock (
) or https:// means you've safely
connected to the .gov website. Share sensitive
information only on official, secure websites.
Heart rate variability (HRV). This figure displays the way HRV is calculated based on the R–R intervals of the QRS complex extracted from the electrocardiogram (ECG) signal.