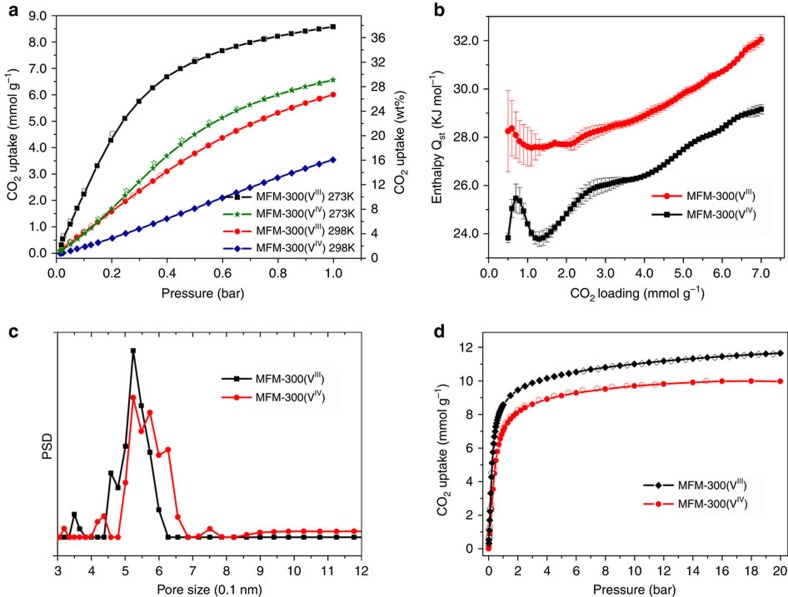
Figure 4. View of the gas adsorption data.
(a) Comparison of the CO2 adsorption isotherms for MFM-300(VIII) and MFM-300(VIV) at 273 and 298 K and 1.0 bar. (b) Variation of isosteric heat of adsorption Qst as a function of CO2 uptake for MFM-300(VIII) and MFM-300(VIV) calculated using the van't Hoff isochore on CO2 adsorption isotherms measured at 273–303 K. Standard deviations are represented by error bars. (c) Comparison of the pore size distribution plots for MFM-300(VIII) and MFM-300(VIV), suggesting a slightly wider pore size in the latter material. (d) Comparison of the CO2 adsorption isotherms for MFM-300(VIII) and MFM-300(VIV) at 273 K up to 20 bar.

