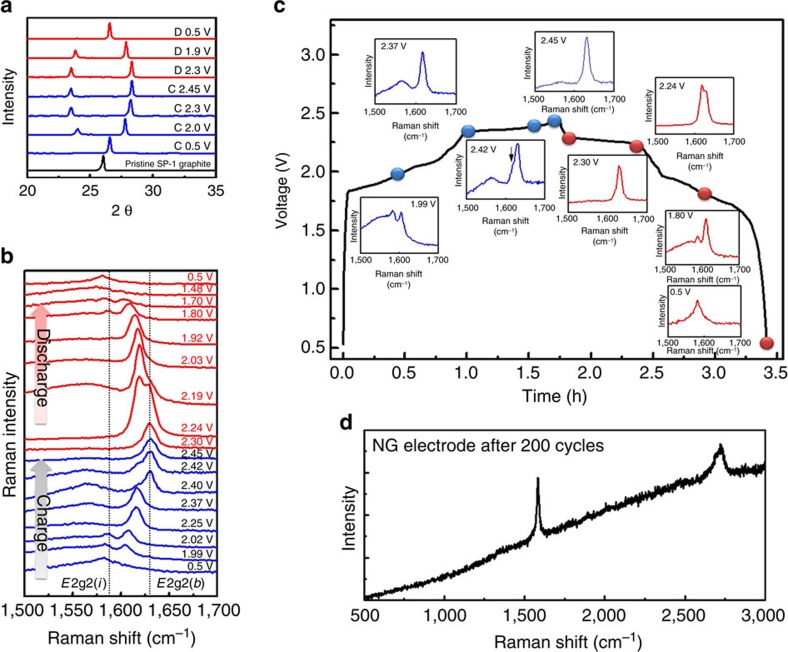
Figure 3. Structural and spectroscopic evolution of natural graphite.
(a) Ex situ X-ray diffraction patterns of NG in various charging and discharging states (denoted C and D in the figure, respectively) through the second cycle. (b) In situ Raman spectra recorded for the NG cathode through a charge–discharge cycle showing chloroaluminate anion intercalation/de-intercalation into graphite. (c) Raman spectra of NG recorded at the charging voltage of 1.99, 2.37, 2.42 and 2.45 V and discharging voltage of 2.3, 2.24, 1.8 and 0.5 V, respectively. (d) Raman spectrum of the NG electrode after hundreds of cycles.

