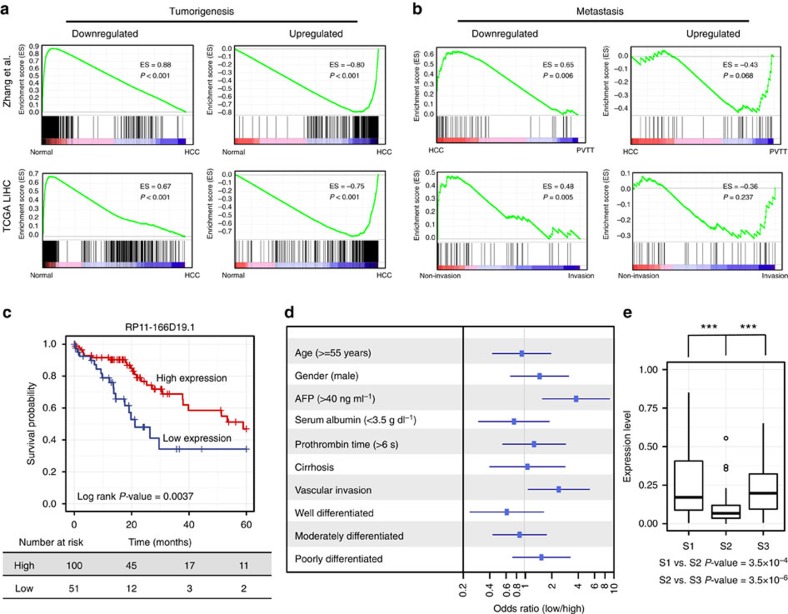
Figure 3. Association of recurrently deregulated lncRNAs with TCGA clinical data and other published data.
(a) Gene set enrichment analysis (GSEA) of recurrently deregulated tumorigenesis-associated lncRNAs based on TCGA LIHC data and published liver cancer data. lncRNAs were rank-ordered by differential expression between adjacent normal tissue and primary tumour samples. (b) GSEA of recurrently deregulated metastasis-associated lncRNAs. lncRNAs were rank-ordered by differential expression between primary tumours with and without vascular invasion in the TCGA LIHC data, as well as by differential expression between primary tumours and PVTTs in published liver cancer data. (c) Kaplan-Meier analysis of overall survival in the TCGA LIHC cohort. Subjects were stratified according to the expression of lncRNA RP11-166D19.1. The P value for Kaplan-Meier analysis was determined using log-rank test. (d) Multivariate analysis using additional clinical information. Forest plot depicting correlations between the indicated clinical criteria and the expression level of RP11-166D19.1. (e) Expression levels (TCGA data) of RP11-166D19.1 in three HCC subclasses (S1, S2 and S3). ***P value<0.001, Wilcoxon rank-sum test.

