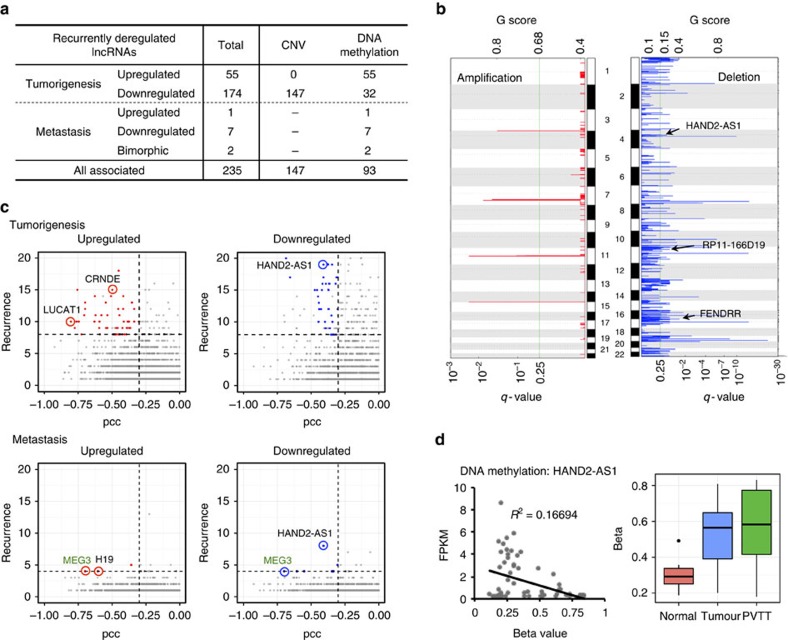
Figure 4. Regulatory mechanisms for recurrently deregulated lncRNAs.
(a) Summary of the regulatory mechanisms of recurrently deregulated lncRNAs. The numbers of lncRNAs associated with CNV and/or DNA methylation data are listed. Bimorphic lncRNAs were those that were recurrently upregulated in some patients and recurrently downregulated in other patients. The total number of lncRNAs is not equal to the sum of each type because of overlapping sub-types. (b) Chromosomal view of amplification and deletion peaks between primary tumours and normal tissue. The G-scores (top) and FDR q-values (bottom) of peaks were calculated using GISTIC2.0. The G-score considered the amplitude of the aberration and its frequency of occurrence across all samples. The q-value was calculated for the observed gain/loss at each locus using randomly permuted events as a control. Examples of recurrently deregulated lncRNAs located in the peaks (only found in deletions) are labelled. (c) Scatterplots showing recurrently deregulated lncRNAs (colour labelled) that were putatively affected by alterations in DNA methylation. Recurrently deregulated lncRNAs driven by DNA methylation had expression levels that were inversely correlated with DNA methylation levels at their promoter regions (PCC, Pearson correlation coefficients<−0.3, x axis). (d) Example of a recurrently deregulated lncRNA driven by DNA methylation; the HAND2-AS1 expression level (FPKM) was inversely correlated with its promoter methylation level (beta value). Boxplot showing that the beta values of primary tumour samples were significantly higher than those of normal tissue samples, but slightly lower than those of PVTT samples.

