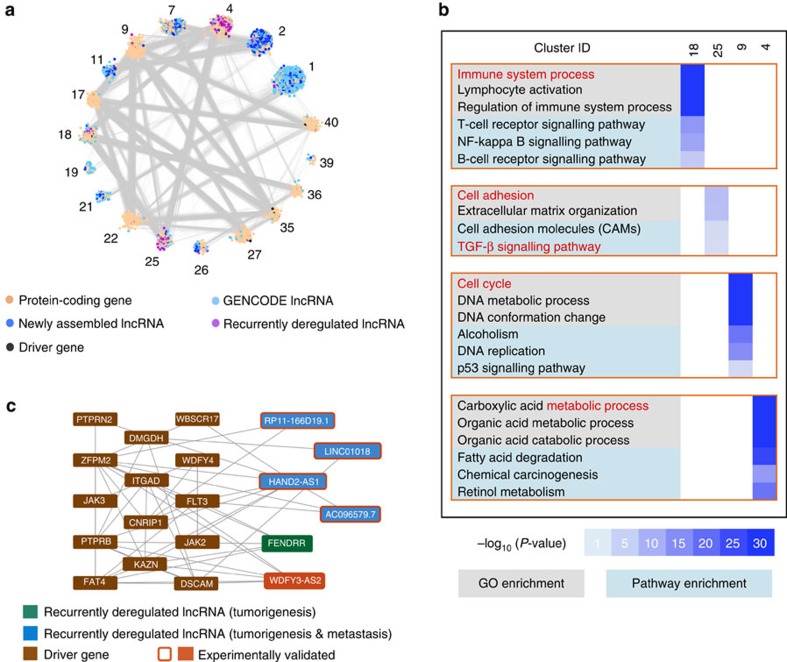
Figure 5. Inference of potential functions for recurrently deregulated lncRNAs using a co-expression network.
(a) Network representation of 18 selected inter-connected clusters in the coding-non-coding co-expression network. (b) GO and KEGG pathway enrichment for four selected clusters (4, 9, 18 and 25). Heatmap showing enrichment scores (−log10(P value)) for GO terms and KEGG pathways in four selected clusters. The most significantly enriched GO terms and KEGG pathways are displayed. (c) Sub-network showing important genes/lncRNAs in cluster 25. The subnetwork depicts the relationships among four lncRNAs and liver cancer-related driver genes.

