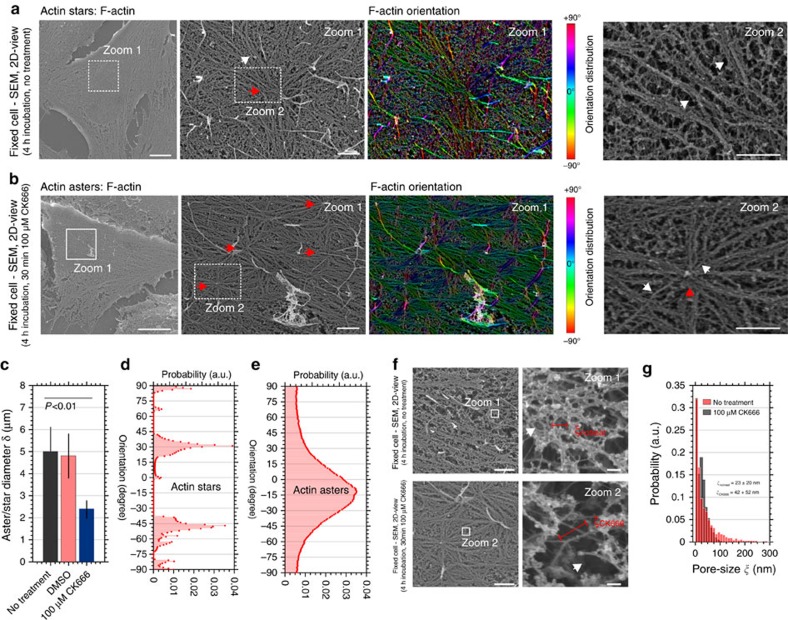
Figure 3. Characterization of asterisk-like actin patterns.
Representative SEM images of the apical side of fixed HeLa cells after 4-h incubation time. (a,b) Overview (left), zoom-in (into white box, middle left) with respective F-actin spatial orientation map (middle right, light blue horizontal to red vertical, −90 to 90) and further zoom-in (into white boxes, right) without (a) and with (b) CK666 treatment, depicting (a) stars (red arrows) with radially-aligned straight filaments (white arrows) and (b) smaller-scale asters (red arrows) characterized by outgoing shorter and buckled filaments (white arrows). (c) Diameters δ (core plus outgoing filaments) of asterisk-like actin pattern without treatment (black), under DSMO control conditions (red) and after CK666 treatment (blue). Mean and error bars (s.e.m.) from Nδ=58, Nδ, DMSO=39 and Nδ, CK666=98 features on 12 SEM images from 12 different cells per samples. P values from Student's t-test. (d,e) Frequency histogram of spatial orientations of F-actin arms (probability distribution) without (d) and with CK666 treatment (e), highlighting the characteristic distributions for stars and asters, respectively, as marked. (f) High magnification SEM (right: zoom-ins into white boxes) without (upper) and with CK666 treatment (lower) indicating changes in sizes of pores within the actin mesh (red bars, pore size diameter ξ). (g) Probability distribution of the diameters ξ of the actin pores (Νξ=2950 and Nξ, CK666=3560 features on 12 SEM images from N=12 different cells per samples) without (red) and with CK666 treatment (grey) showing exponential distribution with given mean values ξnotreat and ξCK666, respectively. Scale bars: 5 μm (overviews) and 1 μm (zoom-ins and high magnifications).

