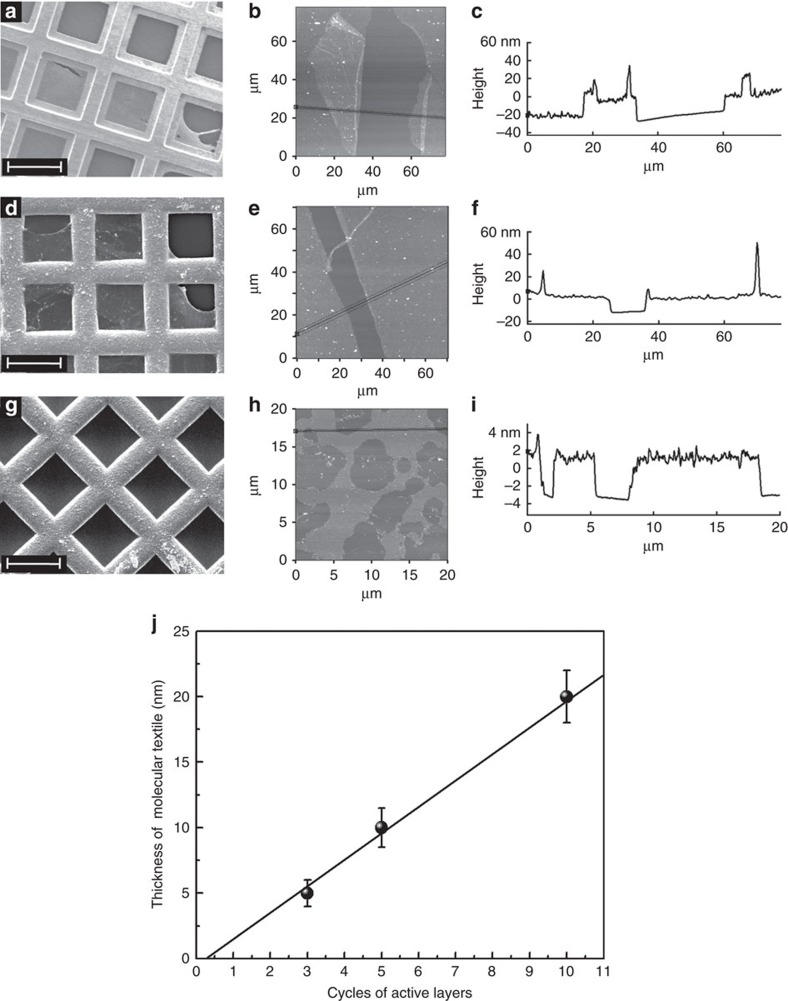
Figure 4. Imaging of molecular textiles.
(a) SEM image of 10 cycles of molecular weaving attached on TEM grids. (b) AFM image and (c) height profile of 10 cycles of molecular weaving attached on a smooth Si substrate. (d) SEM image of 5 cycles of molecular weaving attached on TEM grids. (e) AFM image and (f) height profile of 5 cycles of molecular weaving attached on a smooth Si substrate. (g) SEM image of 3 cycles of molecule weaving attached on TEM grids. (h) AFM image and (i) height profile of 3 cycles of molecular weaving attached on a smooth Si substrate. (j) Dependence of the textiles thickness, as measured by AFM, on the number of cycles to form ABAB-SURMOFs active layers. The length of the white scale bar in the SEM images is 50 μm.

