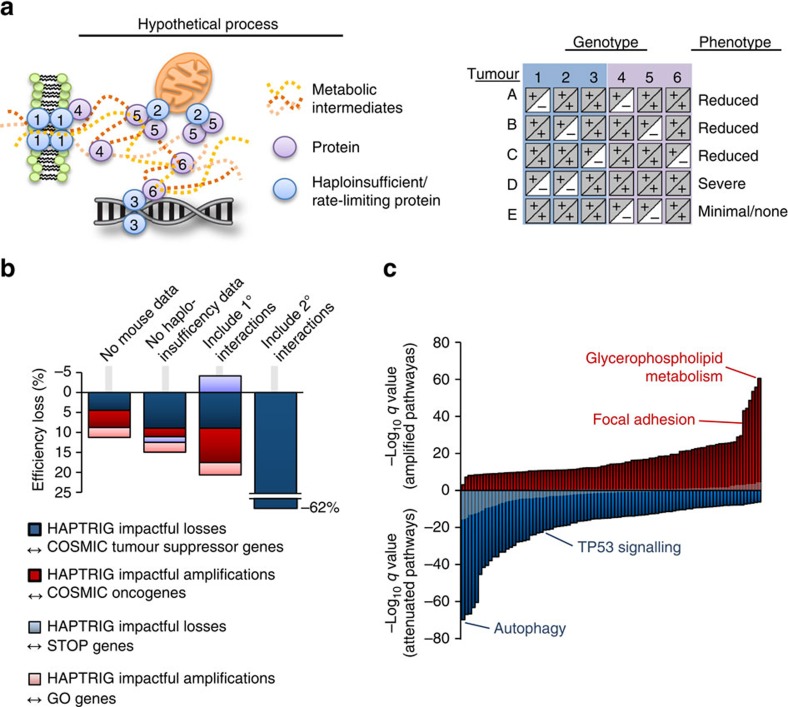
Figure 2. Design of HAPTRIG and OV pan-pathway analysis.
(a) Schematic of the rationale behind designing HAPTRIG network analyses. Genotypes with similar phenotypes can be spread across many genes and each tumour may alter the phenotype using different genes. Haploinsufficient genes are more likely to drive phenotype changes, as are highly interactive genes. (b) Different versions of HAPTRIG were coded and executed to test which inputs prioritized genes with known tumour suppressor or oncogenic function, as annotated in COSMIC, and for ability to prioritize ‘STOP' and ‘GO' genes as expected. HAPTRIG was most effective across all KEGG pathways when considering protein–protein interactions within pathway genes only and when mouse and/or yeast orthologue haploinsufficiency data were included. Including genes that interacted with pathway genes (1° interactors) reduced efficiency as did including genes with an additional interaction distance from pathway genes (2° interactors). (c) HAPTRIG network analyses were created for all distinct, human KEGG pathways (N=187 pathways) and significantly disrupted pathways are plotted by significance compared with a minimally altered SCNA cancer type, thyroid cancer (THCA; in grey overlay). The top-disrupted pathways are noted in comparison with known canonical OV-disrupted pathways, focal adhesion and p53 signalling. Detailed information on these pathways is in Supplementary Data 1, and secondary OV data sets can be found in Supplementary Data 2 and 3.

