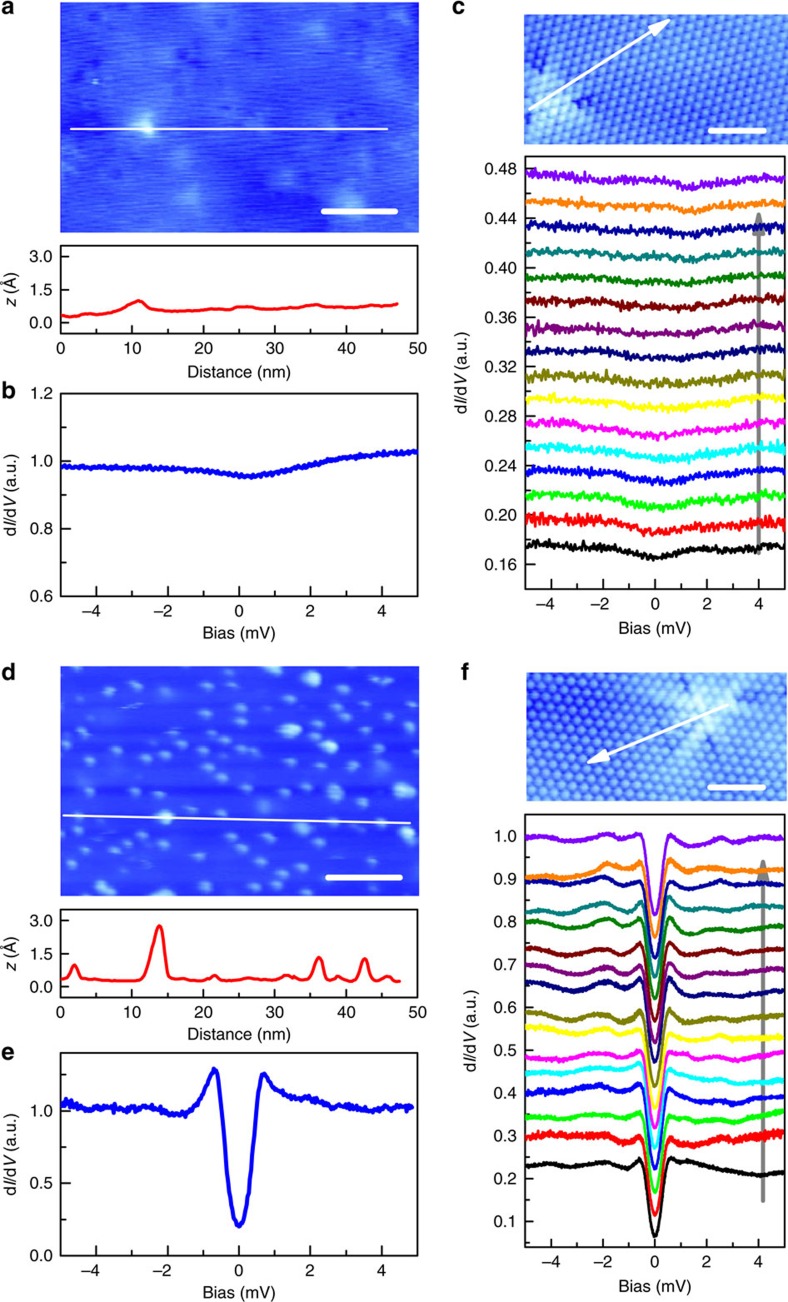
Figure 1. Topographic STM images and tunnelling spectra.
(a,d) Topographic image of the non-superconducting (a) or the superconducting (d) region with different density of Sr clusters. Scale bars, 10 nm. The center of a triangular image in a is roughly corresponding to a substituted Sr impurity. Substituted Sr also exists in the region with well-formed superconductivity with more Sr clusters. The curves in a,d show the height distribution measured along the white lines marked in corresponding topographies. (b,e) A typical tunnelling spectrum measured at 400 mK in non-superconducting (b) or superconducting (e) area with the corresponding topography shown in a or d, respectively. The tunnelling current (It) is 103 pA. (c,f) shows the atomic resolved topography of non-superconducting (c) and superconducting (f) region. Scale bars, 2 nm. The spatially resolved tunnelling spectra taken at zero field and along the arrowed lines are shown below the images measured with It=103 pA.

