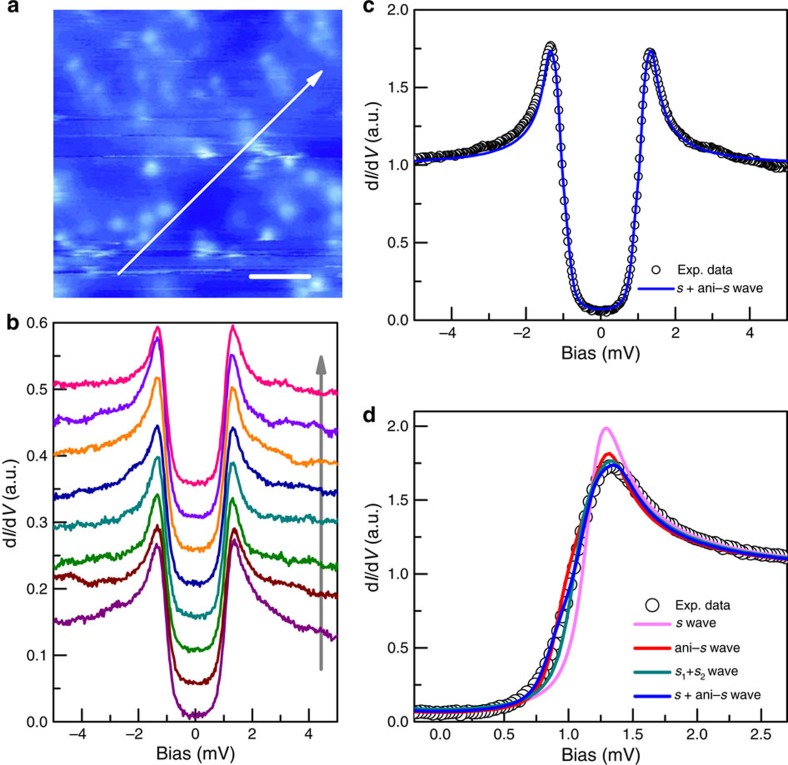
Figure 2. Full superconducting gaps and theoretical fittings.
(a) The topography of the superconducting area with quite dense Sr clusters. Scale bar, 10 nm. (b) The spatially resolved tunnelling spectra taken from a series of points equally spaced along the arrowed line in a at 400 mK, It=102 pA. (c) The averaged and normalized spectrum of the spectra in b. The solid curve is the theoretical fitting with Dynes model using two components (s wave and ani-s wave). (d) The comparison of theoretical fittings with different superconducting gap functions.

