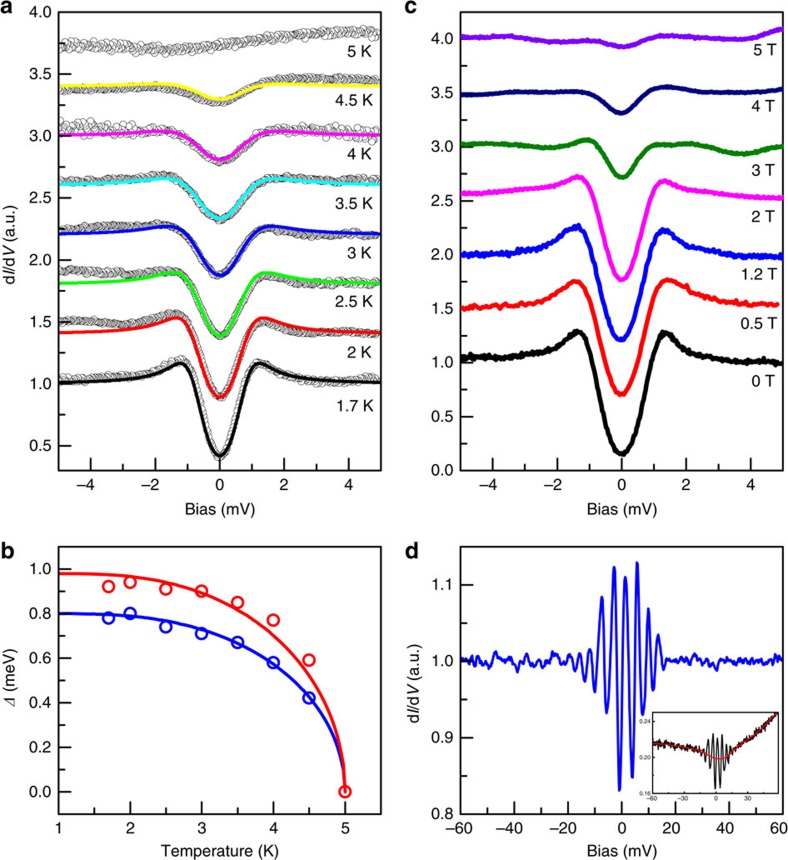
Figure 3. Temperature and magnetic field dependence of tunnelling spectra and Landau levels.
(a) The evolution of the tunnelling spectra with temperatures increased from 1.7 to 5 K at zero field, It=103 pA. The superconducting gapped feature vanishes gradually at about 5 K. The solid lines are theoretical fittings using two components (s wave and ani-s wave). (b) The temperature dependence of Δs (blue dots) and Δani−s (red dots) obtained by fitting. The solid lines are obtained through the numerical solution to the BCS gap equation by fixing Δs(0)=0.8 meV, Δani−s(0)=0.98 meV and Tc=5 K derived from the fitting results in a. (c) Evolution of the tunnelling spectra with magnetic field increased from 0 to 5 T, It=103 pA. Here for each field, the tunnelling spectrum is obtained by averaging the STS data measured at different locations, therefore the oscillations because of the LLs is not visible. (d) The dI/dV spectrum measured at 5 T at a fixed location (smoothed by averaging about 20 STS curves measured at the same location) with the background subtracted. The spectrum has been smoothed by averaging the neighbouring 10 data points to lower down the noise. The black curve of inset shows the raw data. The background is obtained by averaging the neighbouring 200 data points shown as the red curve in the inset, It=102 pA.

