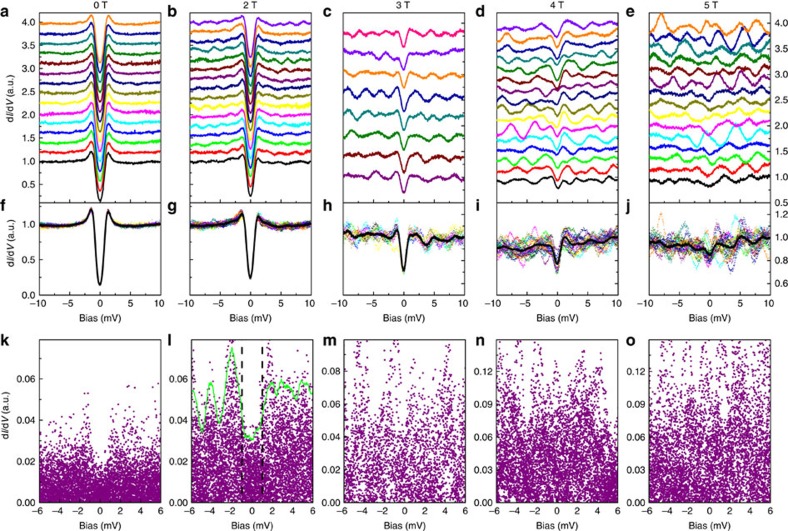
Figure 4. The variation of LL oscillations with magnetic field.
(a–e) The spatially resolved spectra obtained over the same area with the magnetic field of 0, 2, 3, 4 and 5 T, respectively, It=103 pA. (f–j) The experimental data plotted together with the average spectrum at each magnetic field. The black curves are the averaged spectra. (k–o) The absolute value of the differences between the normalized spectrum at different locations and the averaged curve, this exemplifies only the fluctuation because of the LL oscillations. The green line in l is the envelop curve which is defined as 2.5 times of the mean value of the LL oscillations. The mean value is calculated by averaging the data in the region of (−0.2 mV, 0.2 mV) around each bias voltage. The dashed vertical lines in I show the approximate gap value at 2 T. One can see that the oscillations because of the LLs are strongly suppressed within the gap, which can be seen from both the raw data in b,g and the LL oscillations in l.

