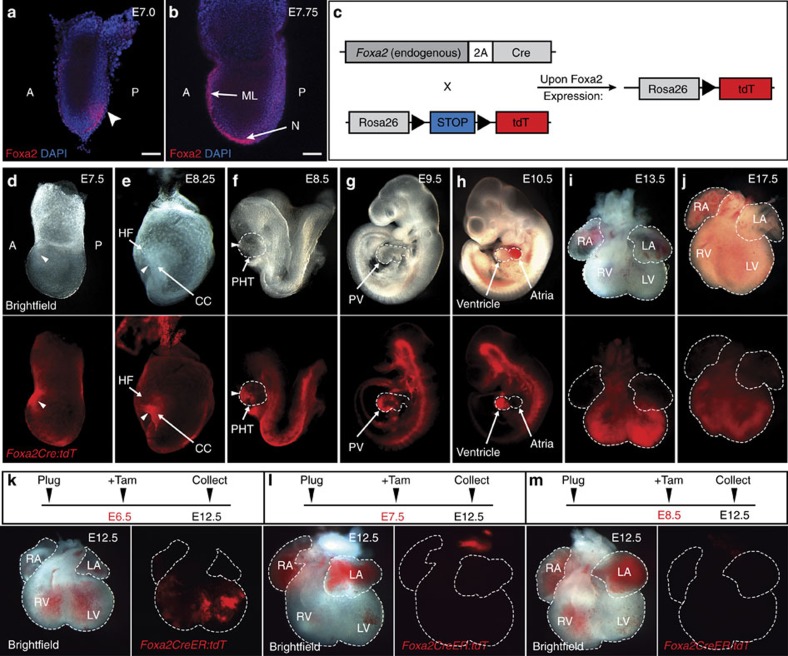
Figure 1. Lineage tracing of Foxa2-expressing cells during mouse development.
(a,b) Representative confocal images of WMIF of E7.0 (a) and E7.75 (b) embryos with antibodies against Foxa2. Embryos were counterstained with 4,6-diamidino-2-phenylindole (DAPI) to label nuclei. Arrowhead shows the presumptive cardiogenic region of the PS. Scale bars, 75 μm. (c) Schematic of the Foxa2 lineage-tracing system that results in permanent labelling of all cells that express Foxa2 during development. (d–j) Whole-mount imaging of Foxa2Cre lineage-tracing embryos (d–h) or dissected hearts (i,j). Foxa2Cre embryos crossed with R26-tdT show labelling of the ventricular portion of the developing heart tube and heart. (k–m) Whole-mount imaging of dissected hearts of Foxa2CreER;tdT embryos. Tam (0.05 mg g−1) was injected at E6.5 (k), E7.5 (l) or E8.5 (m) and embryos were collected at E12.5. Dashed lines outline the heart tube (f–h) or the heart chambers (i–m). A, anterior; CC, cardiac crescent; HF, head folds; LA, left atria; LV, left ventricle; ML, midline; N, node; P, posterior; PHT, primitive heart tube; PV, primitive ventricle; RA, right atria; RV, right ventricle.

