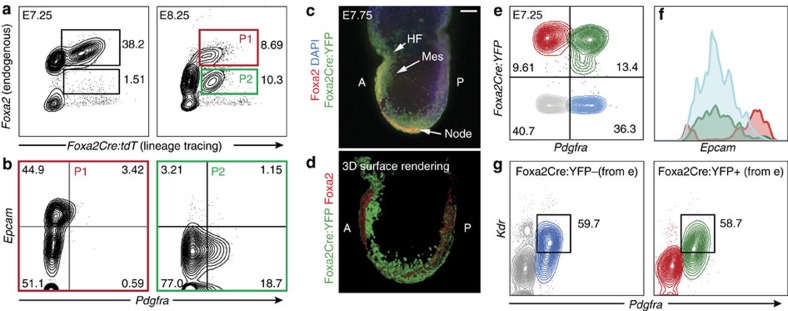
Figure 2. Foxa2 expression marks a transient progenitor population during gastrulation that gives rise to CM.
(a) Flow cytometry analysis of dissociated E7.25 (left) or E8.25 (right) Foxa2Cre:tdT embryos. Cells were stained with antibodies against endogenous Foxa2, which was compared with the Foxa2Cre:tdT lineage tracing marker. (b) Foxa2+tdT+(P1, left panel) and Foxa2-tdT+(P2, right panel) cells from E8.25 embryos were further analysed with antibodies against Epcam (endoderm) and Pdgfra (mesoderm). (c) Confocal z-projection of E7.75 Foxa2Cre:YFP embryo analysed by WMIF using antibodies against YFP and Foxa2. Scale bar, 75 μm. (d) Three-dimensional (3D) surface rendering of image shown in c generated using Imaris software. (e–g) Flow cytometry analysis of dissociated E7.25 Foxa2Cre:YFP embryos with antibodies against Pdgfra, Epcam and Kdr. Cells were first gated based on expression of YFP and Pdgfra (e). The resulting quadrants were then plotted on a histogram for Epcam (f) to assess for endodermal identity of the cells. In addition, the YFP− (grey/blue) and YFP+ (green/red) cells were separately analysed for expression of the CM markers Pdgfra and Kdr (g). A, anterior; P, posterior; HF, head folds; Mes, mesoderm.

