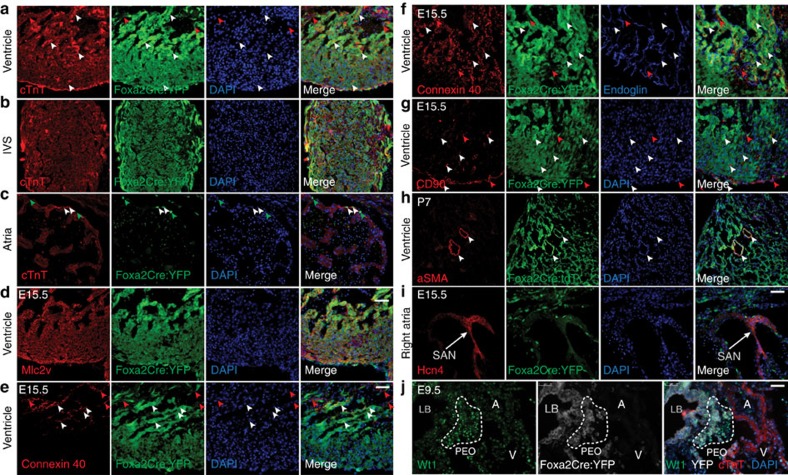
Figure 6. Contribution of Foxa2-vCPs cells to the differentiated lineages in the heart.
(a–i) IF analysis of E15.5 embryos (a–g,i) or P7 hearts (h) using antibodies against YFP or tdT and cTnT (cardiomyocytes, a–c) Mlc2v (ventricular-specific ion channel, d), Connexin 40 (conduction system, e), Connexin 40 and Endoglin (conduction and endothelial cells, f), CD90 (fibroblasts and epicardium, g), aSMA (smooth muscle, h) or Hcn4 (SA node, i). (j) IF analysis of E9.5 embryos with antibodies against Wt1 (PEO). Arrowheads indicate cells that express the relevant markers (red) or that co-express YFP and the relevant marker (white). Dashed line indicates the area of the PEO at E9.5. All images shown are representative of multiple experiments. A, atria; LB, liver bud; PEO, proepicardial organ; V, ventricle. Scale bars, 50 μm.

