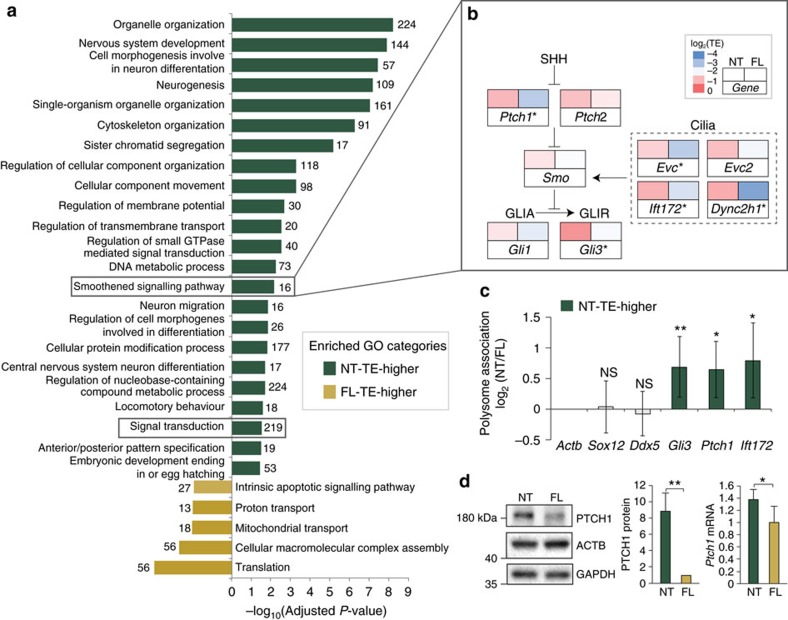
Figure 6. Translational regulation of the Shh signalling pathway between tissues.
(a) Bar graph showing the enriched GO categories of genes with higher TE in the neural tube (NT) in dark green and forelimb (FL) in yellow. The height of each bar shows the significance of enrichment and the number of associated genes in each GO categories with either higher TE in the NT or FL is indicated. Grey boxes highlight the ‘Smoothened signalling pathway' and ‘Signal transduction' GO categories. (b) Comparison of translational efficiency (TE) of Shh pathway components between tissues. Adjacent boxes depict neural tube (NT) and forelimb (FL) TE values colour-coded as shown in the legend. The *marks TE-changed genes, as defined in Fig. 5 (|Δlog2TE|>1 and FDR<0.2). (c) Translation efficiency analysis by orthogonal assay shows increased polysome association of Ptch1, Gli3 and Ift172 transcripts in NT compared with FL lysates confirming increased TE for these transcripts in the NT. (d) Western blot and RT-qPCR analysis confirms that PTCH1 protein levels are increased in the NT relative to the FL with mild change in Ptch1 mRNA levels. (c,d) Error bars represent s.d. (t-test, **P<0.01; *P<0.05, n≥5).

