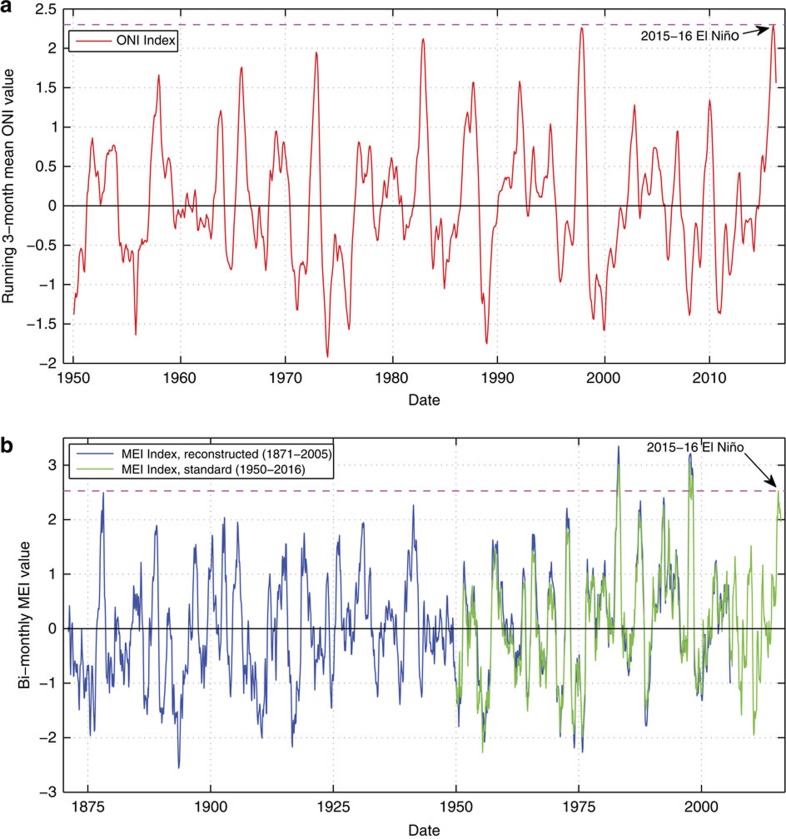
Figure 1. Historical time series of two ENSO indexes.
(a) Oceanic Niño Index (ONI) from 1950 to 2016. Time series of the ONI tracking the 3-month running-mean of sea surface temperature in the East-central tropical Pacific since the inception of the index in 1950 (ref. 18). The El Niño threshold is reached when the ONI reaches +0.5 or greater for 5 consecutive months. The horizontal pink line marks the maximum ONI index value during the 2015–2016 El Niño (data source: http://www.cpc.ncep.noaa.gov/data/indices/oni.ascii.txt). (b) Multivariate ENSO Index (MEI) from 1871 to 2016. Reconstructed time series of the MEI from 1871 to 2005 based on Hadley Centre sea-level pressure and sea surface temperatures19 (data source: http://www.esrl.noaa.gov/psd/enso/mei.ext/table.ext.html), and MEI values from 1950 to 2016 based on the six standard observed variables over the tropical Pacific: sea-level pressure, zonal and meridional components of the surface wind, sea surface temperature, surface air temperature and total cloudiness fraction of the sky20 (data source: http://www.esrl.noaa.gov/psd/enso/mei/table.html). Bi-monthly averaged MEI values for the reconstructed and standard time series are significantly correlated (r2=0.94, P-value<0.0001) during the overlapping time period (1950–2005) and with minimal bias (y=1.0588x+0.0839). The horizontal pink line marks the maximum MEI index value during the 2015–2016 El Niño.

