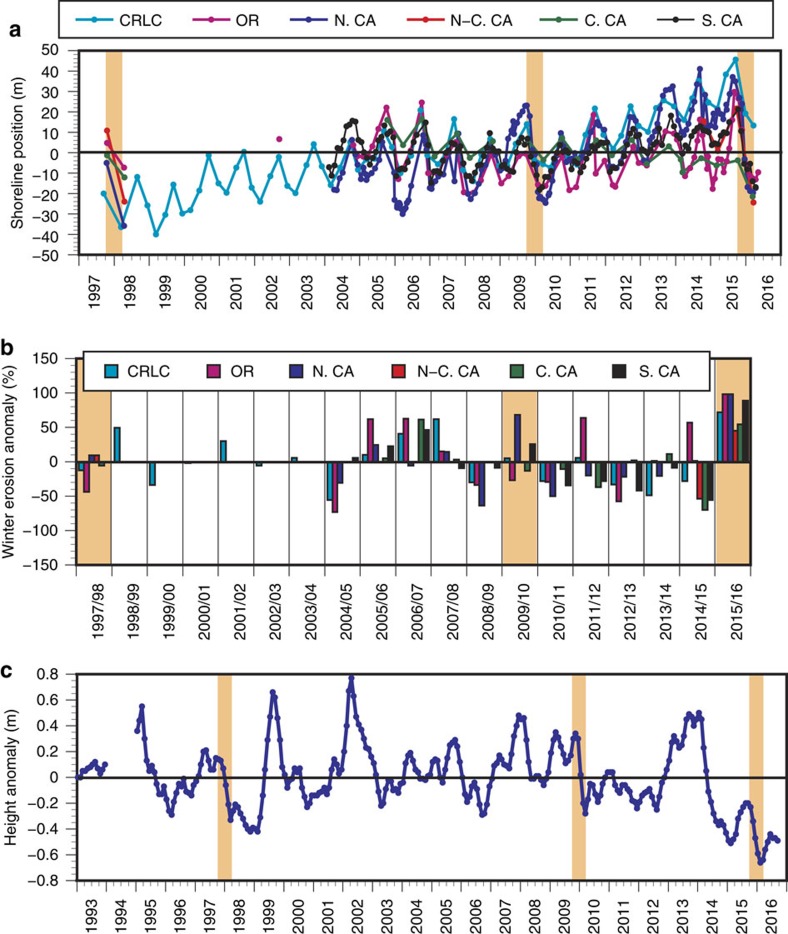
Figure 4. Beach response across the US West Coast.
(a) Time series of shoreline change. De-meaned shoreline position from each region, assimilating the results from 29 surveyed beaches into six study regions (Fig. 2). For local shoreline proxy information, see Supplementary Data 1. (b) Annual winter erosion anomalies. Maximum annual shoreline excursion relative to the mean of all years. See Supplementary Data 2 for the supporting data. (c) Twenty-three year record of sand height. Sand height time series from Isla Vista beach in Central California. Areas shaded in orange highlight the El Niño events of 1997–1998, 2009–2010 and 2015–2016. (CRLC, Columbia River littoral cell (that is, Washington and northernmost Oregon); OR, Oregon; N. CA, Northern California; N-C. CA, North-central California; C. CA, Central California; S. CA, Southern California).

