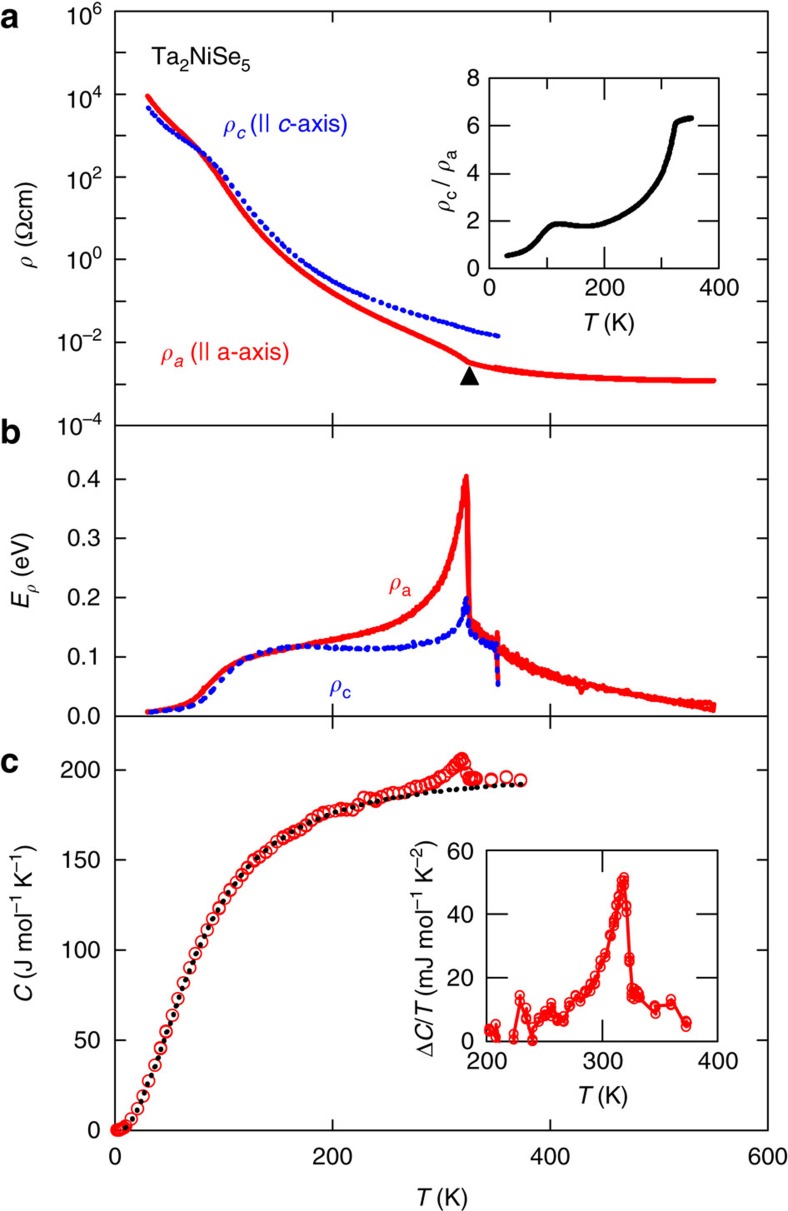
Figure 2. Ta2NiSe5 transport and specific heat.
(a) Temperature dependence of the in-plane resistivity of Ta2NiSe5 single crystal ρa (red) along the a axis parallel to the Ta and Ni chains, and ρc (blue) along the c axis perpendicular to the chains. An anomaly is observed at TC=326 K (emphasized by black triangle). The inset shows the temperature dependence of the resistivity ratio, ρc/ρa as an indicator of the in-plane anisotropy. (b) The temperature dependence of the activation energy Eρ of the resistivity data in a given by Eρ=−kBT2(‖lnρ/‖T). (c) Temperature dependence of heat capacity C of a Ta2NiSe5 single crystal. An anomaly in C at TC is clearly visible. The phonon contribution (black dashed line) is roughly estimated from a Debye fit to the low-temperature data below TC. The inset shows the excess specific heat ΔC/T around TC obtained from the raw heat capacity by subtracting the lattice contribution.

