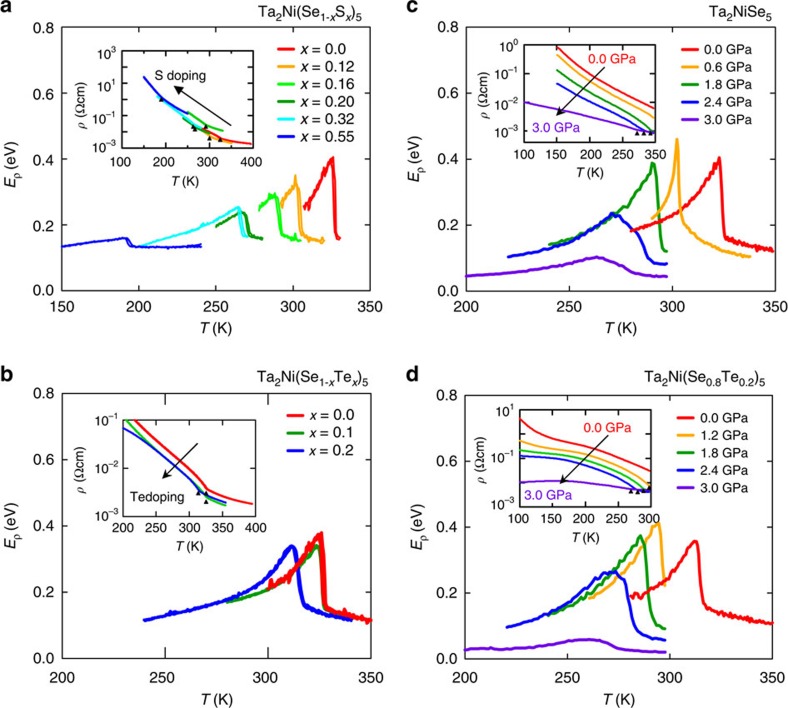
Figure 4. Chemical and physical pressure.
(a) The activation energy plot Eρ=−kBT2(‖lnρ/‖T) for Ta2Ni(Se1−xSx)5 that clearly shows the systematic shift of TC with S doping. The inset shows resistivity curves (I || a axis) as a function of temperature. Triangles mark the transition temperatures for each sample. Variations in absolute values are due to uncertainties in, for example, exact sample dimensions. In b, we show the equivalent data for the Ta2Ni(Se1−xTex)5 series. (c) The activation energy plot as a function of temperature for a single high-pressure experiment showing both the systematic reduction of Eρ with pressure as well as the suppression of TC. Additional data from a high-temperature run are also included. The inset shows the equivalent resistivity data with emphasis of TC by triangles. (d) Equivalent data to c for Ta2Ni(Se0.8Te0.2)5.

