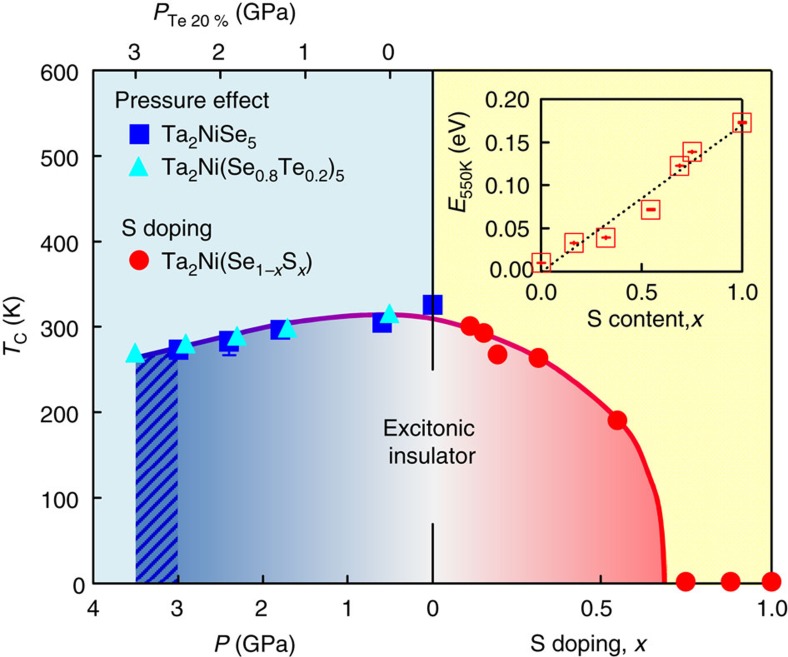
Figure 5. Phase diagram.
Phase diagram of the excitonic insulator phase in Ta2NiSe5 given by the transition temperature TC as a function of S doping (right) and pressure and Te doping (left), corresponding to the semiconducting and the semimetallic regions in the predicted phase diagram respectively. The pressure effect on Ta2Ni(Se0.8Te0.2)5 is also shown in the left region with an offset of chemical pressure of 0.5 GPa (see text). The shaded area in the left region indicates the region for phase separation behaviour at high pressures (see text), likely originating from a first-order transition. The inset shows the S doping x dependence of the transport activation energy of resistivity at high temperatures (500–550 K), E550 K. E550 K gives a measure of the one electron gap EG and indicates that EG increases monotonically as a function of x from almost zero for x=0 to at least a few tenths of an eV for x=1.0. The sulfur substitution level x and pressure P may therefore be mapped onto the single band gap EG in the high-temperature phase.

