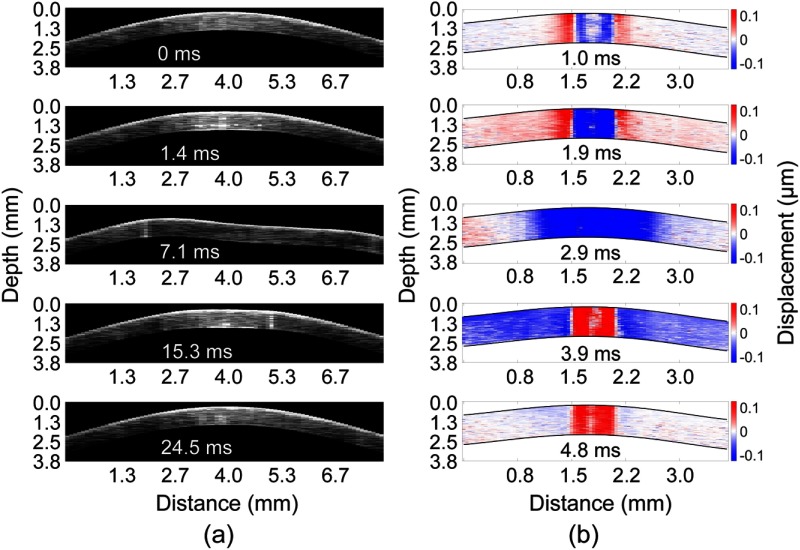
Fig. 2.
(a) Selected frames from Video 1 showing OCT imaging of the noncontact applanation, which was imaged at a frame rate of . The inward and outward applanation times are shown at 1.4 and 15.3 ms, respectively. (b) Selected frames from Video 2 showing the propagation of the focused micro air-pulse induced elastic wave in the cornea. Both data sets are at an IOP controller setting of 10 mmHg, and the times after excitation are labeled for each respective frame (Video 1, MP4, 6.5 MB [URL: http://dx.doi.org/10.1117/1.JBO.22.2.020502.1] and Video 2 MP4, 4 MB [URL: http://dx.doi.org/10.1117/1.JBO.22.2.020502.2]).

