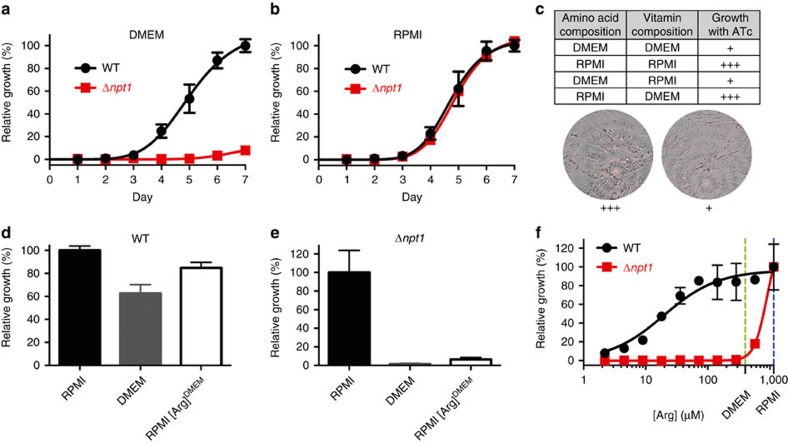
Figure 2. Growth of parasites lacking TgNPT1 is modulated by arginine.
(a,b) Fluorescence growth assays for WT (black) and Δnpt1 (red) parasites grown in DMEM (a) or RPMI (b). Growth is expressed relative to the maximum growth of WT parasites on the final day of the experiment under each of the conditions tested. The data shown are averaged from three technical replicates (±s.d.) and are representative of those obtained in three biological replicates. (c) Growth of iTgNPT1 parasites in the presence of ATc in medium having the concentrations of amino acids and vitamins present in either RPMI or DMEM. The parasites grew well (+++) in medium containing the concentrations of amino acid present in RPMI, but poorly (+) in medium containing the concentrations of amino acids present in DMEM. (d,e) Growth of WT (d) and Δnpt1 (e) parasites in the following media: RPMI (black), DMEM (grey) or RPMI containing the concentration of arginine present in DMEM (400 μM; RPMI[Arg]DMEM; white). Parasites were cultured until those grown in RPMI reached mid-logarithmic stage. The growth of parasites in each medium is plotted as a percentage of the average growth of parasites in RPMI. The average of three technical replicates±s.d. of a single experiment are shown. (f) Fluorescence growth assay for WT (black) and Δnpt1 (red) parasites grown for 4 days in media containing a range of arginine concentrations. Parasite growth is expressed as a percentage of that measured at the highest arginine concentration (1.15 mM) for each parasite line. The arginine concentrations in DMEM and RPMI are indicated by the vertical green and blue dashed lines, respectively. The data shown are averaged from three technical replicates (±s.d.) and are representative of those obtained in three biological replicates.

