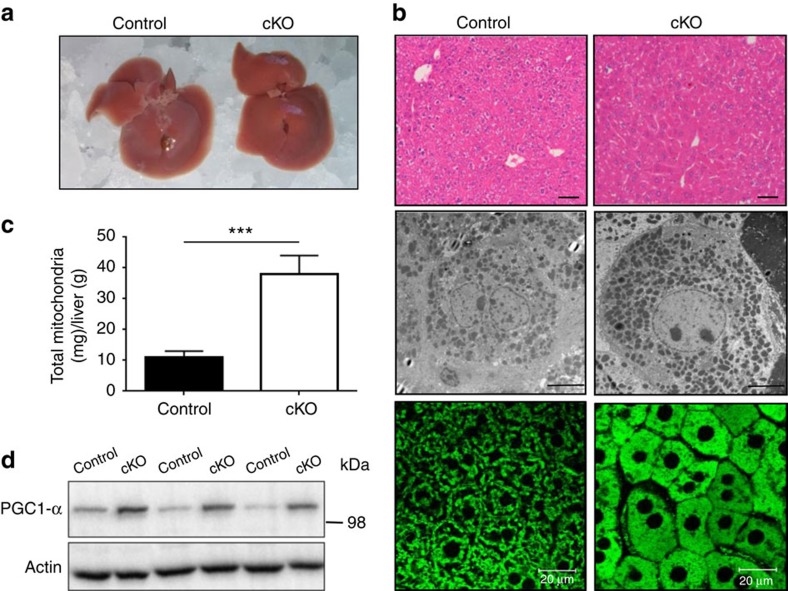
Figure 2. Increases in mitochondrial numbers in the Ant2 cKO liver.
(a) Representative images of liver gross appearance (n=10), (b) Representative images of H&E staining, Scale bar; 40 μm (upper panel), transmission electron microscopy analysis Scale bar; 5 μm (middle panel) and multiphoton microscopy analysis after the liver was perfused with Rhodamine-123 Scale bar; 20 μm (lower panel; n=5), (c) mitochondrial mass per gram of liver (n=5; ***P<0.001 by t-test, error bars=s.d.), and (d) immunoblot analysis of the liver.

