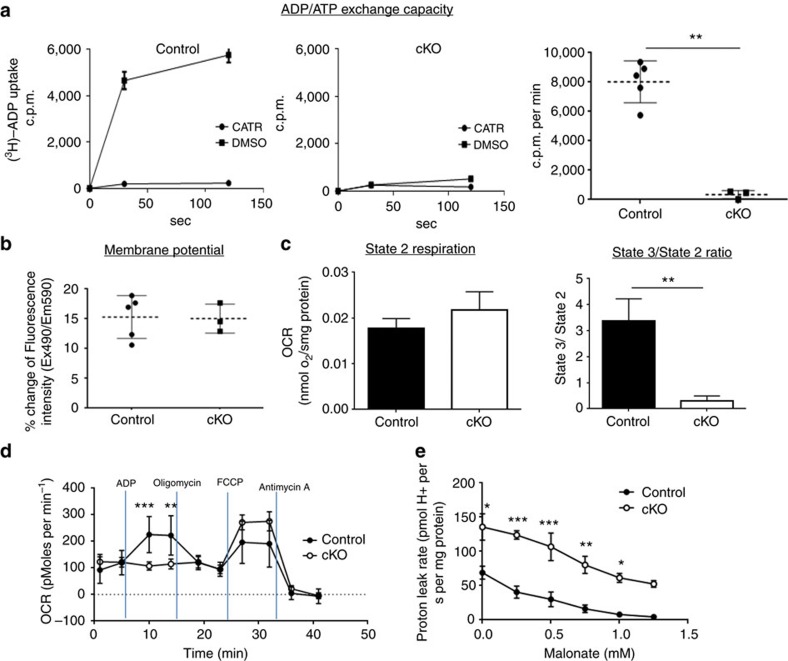
Figure 3. Characterization of Ant2-deleted liver mitochondria.
(a) ADP/ATP exchange capacity measured by [3H]ADP uptake in the presence or absence of the ANT specific inhibitor, carboxyatractyloside (CATR). Left two panels show representative data from control and Ant2 cKO liver mitochondria, while the far right graph shows the average of multiple experiments (n=5; **P<0.01 by t-test, error bars=s.d.). (b) Membrane potential assessed by JC1 dye. (c) Mitochondrial oxygen consumption rate (OCR) measured using a Hansatech Oxygraph unit. The state 2 respiration represents the basal respiration rate under glutamate while the state 3 respiration rate was measured after the addition of ADP (n=5; **P<0.01 by t-test, error bars=s.d.). (d) Mitochondrial OCR assessed with XF24 extracellular flux analyzer (Seahorse) under sequential treatment of ADP, oligomycin, FCCP, and Antimycin A (n=5; **P<0.01, ***P<0.001 by t-test, error bars=s.d.). (e) Proton leak rate of isolated liver mitochondria was assessed with Oroboros O2k respirometer in the presence of succinate, rotenone, oligomycin and increasing concentrations of malonate (n=5, *P<0.05, **P<0.01, ***P<0.001 by t-test, error bars=s.d.).

