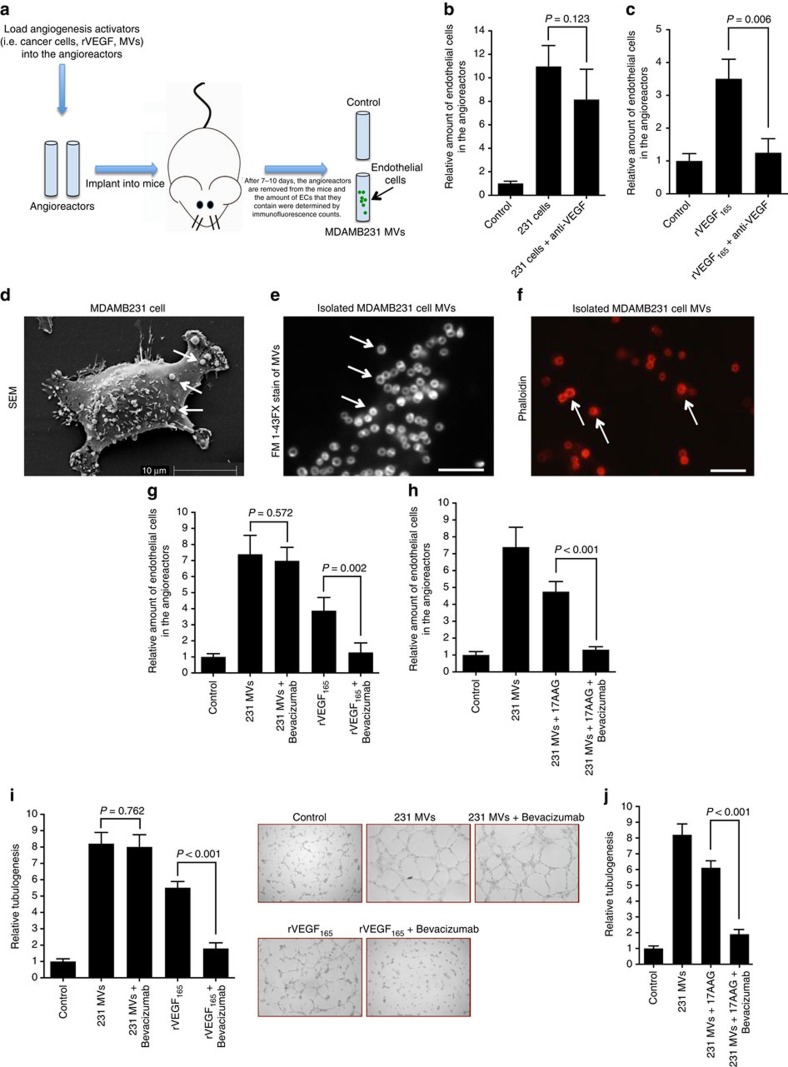
Figure 2. Reconstitution of Bevacizumab and 17AAG sensitivity.
(a) Schematic of the in vivo angiogenesis assay. (b,c) Relative amounts of endothelial cells that entered implanted angioreactors that lacked any activators (vehicle control; histogram 1 in both graphs), or were loaded with MDAMB231 cells (5 × 10⁴ cells per angioreactor) without (b, histogram 2) or with a pan inactivating VEGF antibody (200 ng per angioreactor; b histogram 3) or were loaded with rVEGF165 (4 ng per angioreactor) without (c histogram 2) or with VEGF antibody (200 ng per angioreactor; C, histogram 3). (d) Scanning electron microscopy (s.e.m.) of a MDAMB231 cell. Arrows indicate large EVs. (e) MVs from MDAMB231 cells were examined by fluorescence staining using the membrane dye FM 1-43FX. Arrows indicate MVs. Scale bar, 5 μm. (f) MVs isolated from MDAMB231 cells were examined using rhodamine-conjugated phalloidin. Arrows indicate MVs. Scale bar, 5 μm. (g) The relative amounts of endothelial cells that entered angioreactors that lacked activators (control; histogram 1), contained MDAMB231 cell MVs (2 μg total protein per angioreactor) without (histogram 2) or with Bevacizumab (1 μg per angioreactor; histogram 3) or contained rVEGF165 (4 ng per angioreactor) without (histogram 4) or with Bevacizumab (1 μg per angioreactor; histogram 5). (h) Relative amounts of endothelial cells that entered angioreactors that lacked activators (vehicle control; histogram 1), or angioreactors that contained the indicated combinations of MDAMB231 cell MVs (2 μg per angioreactor), 10 μM 17AAG and 1 μg Bevacizumab (histograms 2–4). (i) Tubulogenesis assays of HUVECs left untreated (control; histogram 1), treated with MVs (10 μg ml−1 total protein) from MDAMB231 cells without (histogram 2) or with 0.5 μg ml−1 Bevacizumab (histogram 3) or treated with rVEGF (15 ng ml−1) without (histogram 4) or with 0.5 μg ml−1 Bevacizumab (histogram 5). Left: The relative differences in tube lengths were plotted. Right: Images of the tubulogenesis assays performed under the different conditions tested. (j) Tubulogenesis assays were performed on HUVECs that were untreated (control; histogram 1) or treated with MVs (10 μg ml−1 of MV protein) from MDAMB231 cells pre-treated with various combinations of 10 μM 17AAG and 0.5 μg ml−1 Bevacizumab (histograms 2–5).

