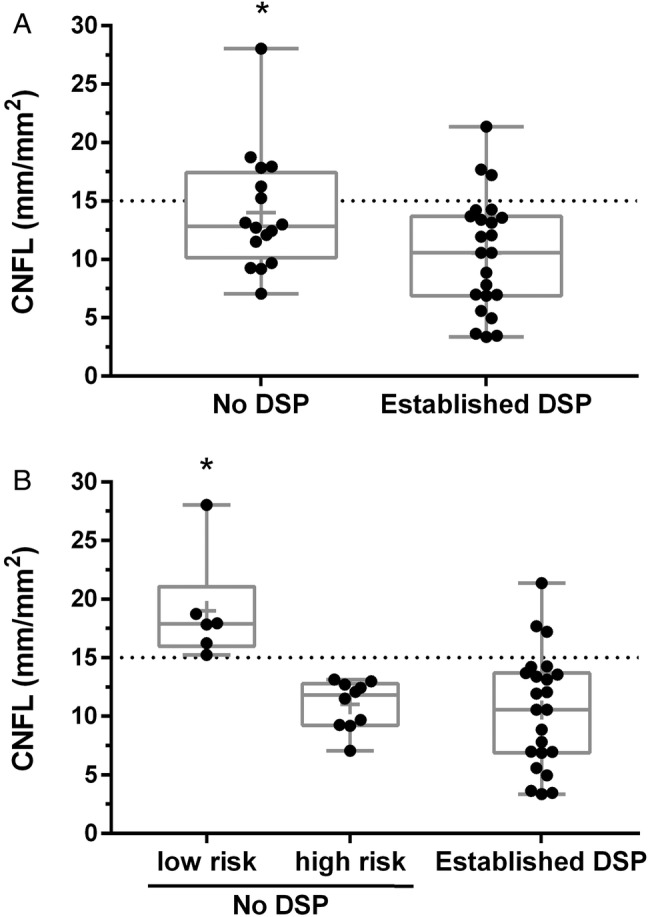
Figure 1.

Box- and whisker plots demonstrating the distribution of 300 μm manual trace corneal nerve fiber length (CNFL) in 39 type 1 diabetic participants. The dashed line represents CNFL 15 mm/mm2. Panel A shows CNFL in those with and without diagnosed DSP. * Indicates significantly higher than Established DSP cases. Panel B shows participants divided into three groups based on DSP status and future risk: No DSP, low risk (CNFL >15 mm/mm2), No DSP, high risk (CNFL <14.9 mm/mm2), Established DSP. + Bonferroni post hoc analysis indicates significantly higher CNFL than other groups. CNFL, corneal nerve fiber length; DSP, diabetic sensorimotor polyneuropathy.
