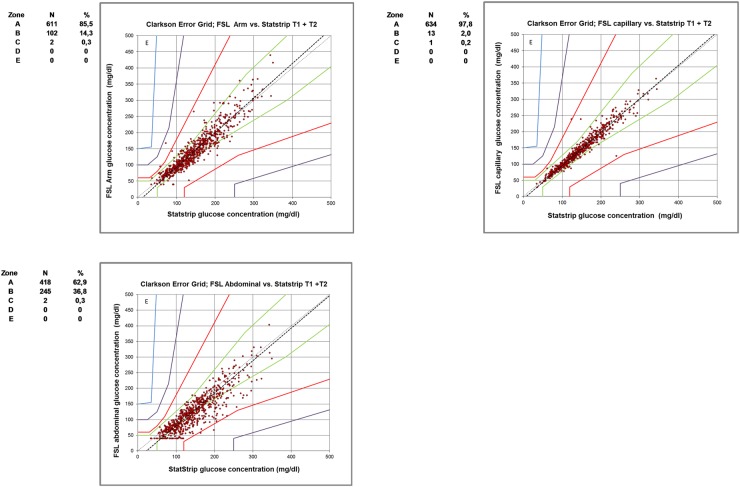
Figure 1.
Clarke Error Grids (ISO15197; 2013) of StatStrip and coincident FSLTab-CGM arm (upper left panel), FSL-CGM abdomen (lower left panel) and FSLC readings (right panel) in the combined population of type 1 and 2 diabetes. Number and percentages of paired readings within error grid zones A, B, C D and E are presented. FSL-CGM, FreeStyle Libre Flash continuous glucose monitoring.

