
Figure 2.
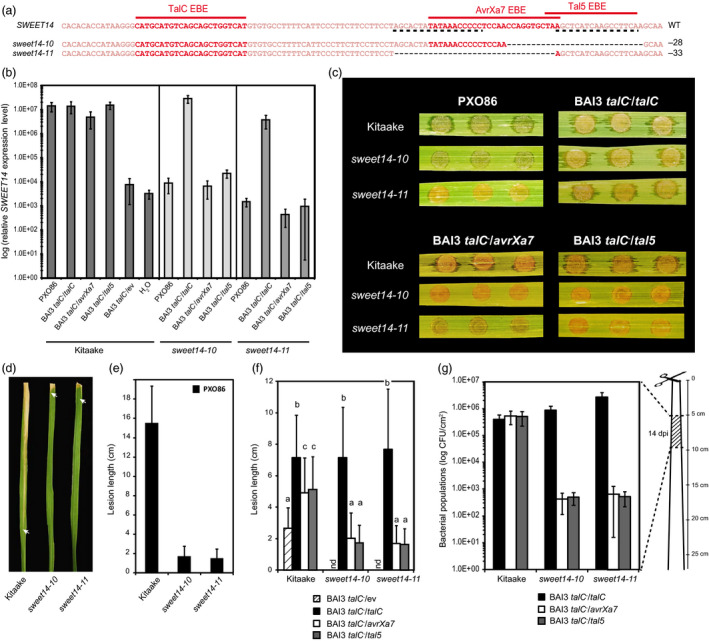
Functional analysis of two Kitaake edited lines carrying deletions in AvrXa7 and/or Tal5 EBEs. (a) Location of the studied mutations on the SWEET14 promoter (same fragment as in Figure 1). (b) SWEET14 expression pattern obtained by RT‐qPCR 2 days post‐leaf infiltration with the indicated strains. The graph uses a base‐10 logarithmic scale. Bars represent the average expression obtained from four independent RNA samples, with standard deviation. (c) Water‐soaking symptoms obtained after leaf infiltration with the indicated strain. Pictures were taken 5 days post‐inoculation (dpi). (d and e) Qualitative (d) and quantitative (e) evaluation of the disease symptoms obtained 14 days post‐leaf clipping inoculation with the PXO86 wild‐type strain. For d, lesions were photographed at 14 dpi and arrow heads indicate the end of the lesion. On e, bars represent the average and standard deviation obtained from N > 30 symptomatic leaves. (f) Lesion length measured 21 days post‐leaf clipping inoculation with the indicated BAI3 derivative strains. Bars represent the average and standard deviation obtained from N > 20 symptomatic leaves. The letters above the bars represent the result of a Tukey's HSD statistical test. Identical letters indicate means that are not significantly different from each other (α = 0.05). ‘nd’, not determined. (g) Bacterial populations extracted at 14 days post‐leaf clipping inoculation from the 5‐cm leaf segment as depicted on the cartoon. The graph uses a base‐10 logarithmic scale. Bars represent the average and standard error obtained from four independent leaf samples.