
Figure 3.
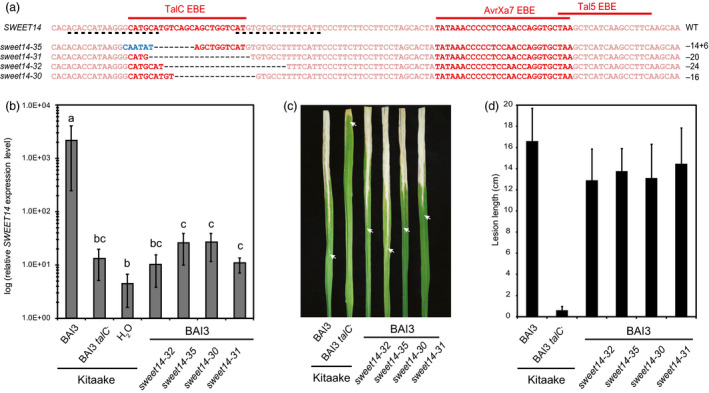
Functional analysis of four Kitaake edited lines carrying mutations in TalC EBE. (a) Location of the studied mutations on the SWEET14 promoter (same fragment as in Figure 1). (b) SWEET14 expression pattern obtained by RT‐qPCR 2 days post‐infiltration with the indicated strains. Bars represent the average expression obtained from four independent biological experiments, each including four independent RNA samples (16 in total), with standard deviation. The letters above the bars represent the result of a Tukey's HSD statistical test. Identical letters indicate means that are not significantly different from each other (α = 0.05). (c and d) Lesion length photographed (c) or measured (d) 14 days post‐leaf clipping inoculation with the BAI3 wild‐type or talC mutant strain. On (c), arrow heads indicate the end of the lesion. On (d), bars represent the average and standard deviation obtained from N > 30 symptomatic leaves.