
Figure 6.
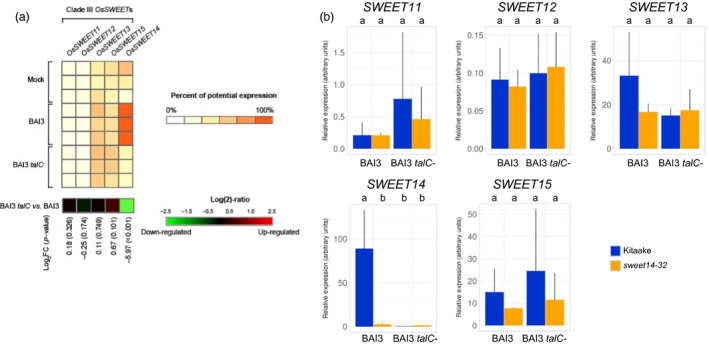
Expression of the five clade‐III OsSWEET genes in response to BAI3 or a talC mutant. (a) Gene expression derives from previously published microarray data and analysed using Genevestigator. The heat‐map displays the percent of potential expression for SWEET11 ( LOC_Os08 g42350), SWEET12 ( LOC_Os03 g22590), SWEET13 ( LOC_Os12 g29220), SWEET15 ( LOC_Os02 g30910) and SWEET14 ( LOC_Os11 g31190). Each row refers to an independent replicate of the microarray experiment. The last row of the heat‐map represents the log2 of the expression ratio between conditions ‘BAI3 talC − mutant’ vs. ‘BAI3 WT’, with associated P‐value (into brackets). (b) Clade‐III SWEET genes expression was measured by RT‐qPCR 2 days post‐infiltration of the sweet14‐32 line or the Kitaake background with the wild‐type BAI3 or the BAI3 talC − mutant strains. Bars represent average expression obtained from three independent RNA samples, with standard deviation. Letters above the bars represent the result of a Tukey's HSD test. Identical letters correspond to means that are not significantly different from each other (α = 0.05). This experiment was repeated three times with similar results.