
Figure 5.
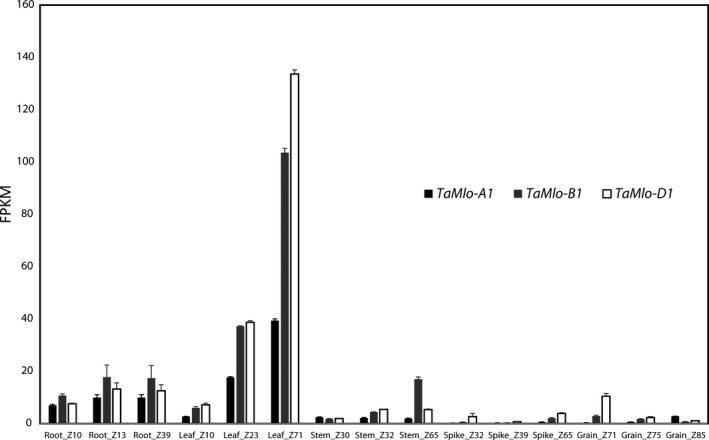
Transcript accumulation of TaMlo homoeologues in five bread wheat tissues at different developmental stages. Transcript levels of each homoeologue were summed up and then averaged across replicates, ± standard errors of the mean. FPKM: Fragments per kb per million mapped reads; Z: Zadoks developmental scale (Zadoks et al., 1974).