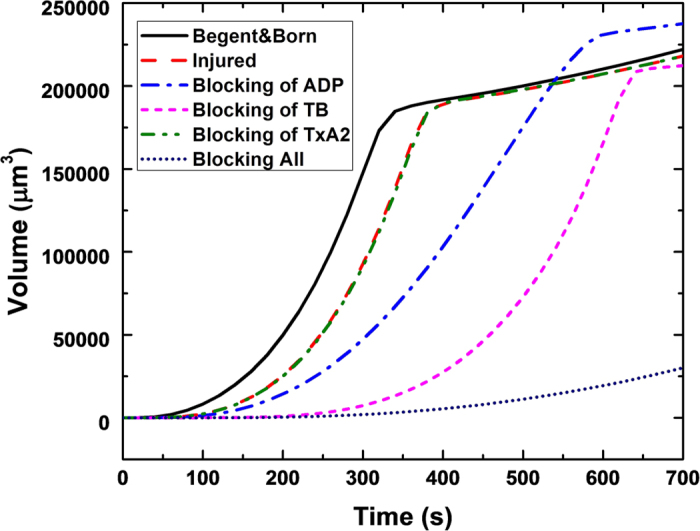
Figure 7. Time course of thrombus formation (volume) to total vessel occlusion with different agonists blocked.

The plateaus exhibited by most of the cases correspond to occlusion of the vessel, followed by gradual longitudinal growth, driven primarily by diffusion.
