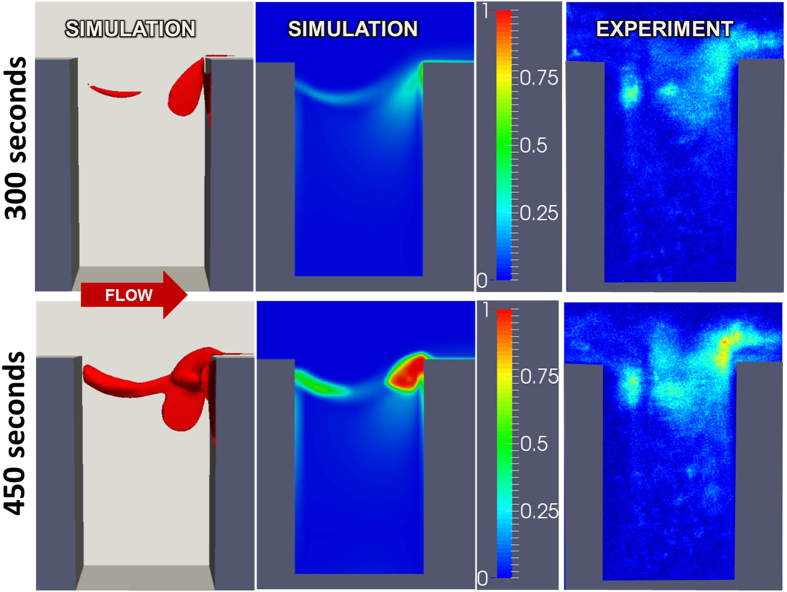
Figure 9. Comparison of thrombus deposition by simulation versus microscopic experiment at t = 300 and 450 s with crevice length Lc = 0.075 mm.
Left panel is a 3D rendering of the simulated thrombus. Center and right panels indicate volume fraction of platelets in the near-wall region of the channel.

