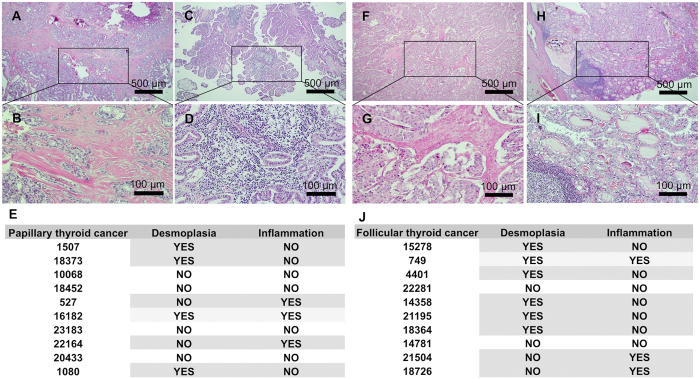
Figure 1.
Representative histological images of hematoxylin-eosin staining of sections from papillary (A–D) and follicular (F–I) thyroid cancer. (A,B) Papillary thyroid cancer regions with desmoplastic stroma. (C,D) Papillary thyroid cancer regions with mononuclear cell infiltration. (E) Table showing papillary thyroid cancer patient numbers and the corresponding desmoplasia and/or inflammation. (F,G) Follicular thyroid cancer regions with desmoplastic stroma. (C,D) Follicular thyroid cancer regions with mononuclear cell infiltration. (E) Table showing follicular thyroid cancer patient numbers and the corresponding desmoplasia and/or inflammation. Calibration bars: 500 μm (A,C,F,H); 100 μm (B,D,G,I).

