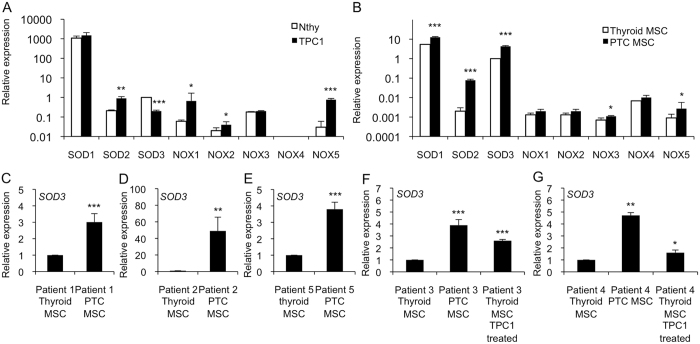
Figure 4. Gene expression of SOD1-3 and NOX1-5 in thyroid cells.
We used Nthy cells modeling normal thyroid epithelia, TPC1 cells modeling papillary thyroid cancer, Thyroid MSCs, and PTC MSCs. (A) SOD1, SOD2, NOX1-3 and NOX5 showed increased expression levels in TPC1 cells compared to in the Nthy cell line, whereas SOD3 expression was downregulated in the TPC1 cells. NOX4 expression was not detectable. (B) SOD1, SOD2, NOX1-3, and NOX5 expression levels in the PTC MSCs were increased or remained at the same level as in the Thyroid MSCs. SOD3 expression was significantly higher in the PTC MSCs compared to in the Thyroid MSCs. There was high NOX4 expression in both the Thyroid MSCs and the PTC MSCs. (C–G) Increased SOD3 mRNA synthesis was confirmed in each of the five patients. (F,G) Expression analysis using TPC1-condensed medium suggested a cancer-derived paracrine effect in SOD3 activation. The p-values (*p < 0.05, **p < 0.01, ***p < 0.001) were determined by two-tail independent samples t-tests.

