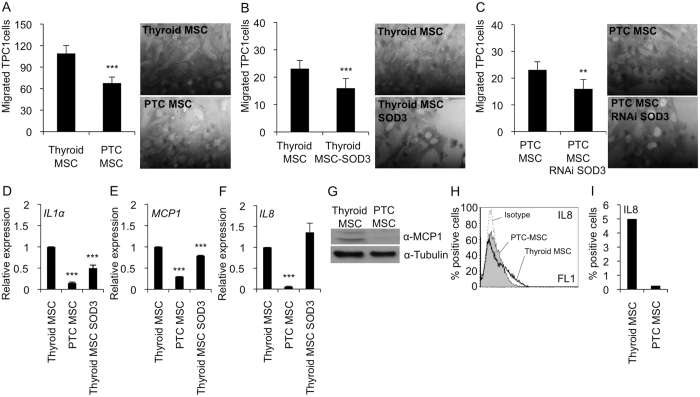
Figure 6. Effect of SOD3 on TPC1 cancer cell migration.
(A) TPC1 cancer cells migrated significantly faster towards Thyroid MSCs than PTC MSCs. Representative high-power fields from Matrigel shown. (B) Increased SOD3 expression in Thyroid MSCs significantly decreased TPC1 cell migration. Representative high-power fields from Matrigel are shown. (C) Reduced SOD3 expression reduced TPC1 cell migration toward PTC MSCs. Representative high-power fields from Matrigel are shown. (D) IL1α expression was significantly decreased in the PTC MSCs compared to the Thyroid MSCs. SOD3 over-expression in Thyroid MSCs significantly reduced IL1α mRNA synthesis compared to the Thyroid MSC control. (E) MCP1 mRNA expression was significantly decreased in PTC MSCs compared to Thyroid MSCs. SOD3 over-expression in the Thyroid MSCs significantly reduced MCP1 mRNA synthesis compared to the Thyroid MSC control. (F) IL8 mRNA expression was significantly decreased in the PTC MSCs compared to the Thyroid MSCs. SOD3 over-expression in the Thyroid MSCs did not affect IL8 expression. (G) MCP1 Western blot confirmed decreased MCP1 mRNA expression in the PTC MSCs compared to the Thyroid MSCs. (H) Flow cytometer analysis of IL8 expression confirmed decreased IL8 mRNA expression in the PTC MSCs compared to Thyroid MSCs. (I) Percentage of positive cells in the IL8 flow cytometer analysis. The p-values (*p < 0.05, **p < 0.01, ***p < 0.001) were determined by two-tail independent samples t-tests.

