
Figure 5.
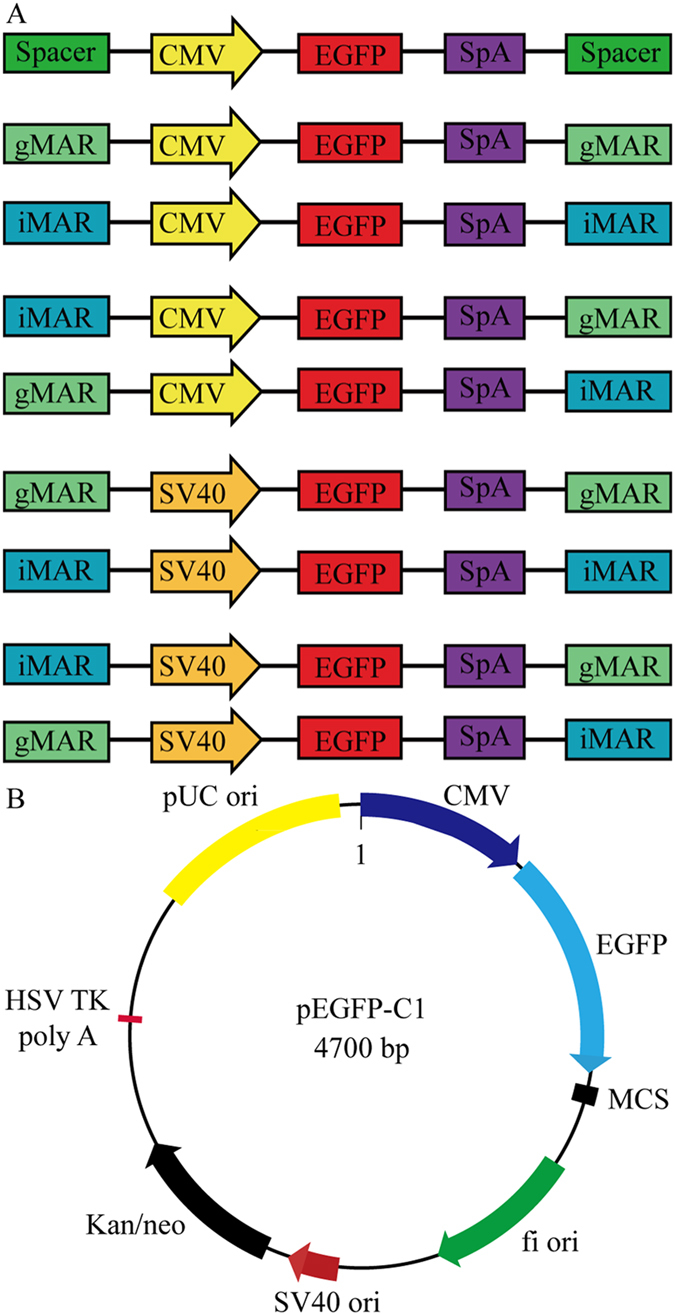
Schematic representation of vectors for evaluating the impact of different MARs combination on recombinant protein expression level and stability in CHO cells (A). Map of pEGFP-C1 used in this study (B). SpA, simian virus 40 early polyadenylation signal; eGFP, enhanced green fluorescence protein.